How to add taxonomy to feature-table.qza and get otu id of each taxonomy and number of otus

hi I don’t know how to use qiime1 and new to qiime2,after i run the following:
biom add-metadata -i feature-table.biom -o table-with-taxonomy.biom --observation-metadata-fp biom-taxonomy.tsv --sc-separated taxonomy
qiime tools import
–input-path table-with-taxonomy.biom
–type ‘FeatureTable[Frequency]’
–source-format BIOMV210Format
–output-path feature-table-2.qza
qiime taxa barplot
–i-table feature-table-2.qza
–i-taxonomy taxonomy.qza
–m-metadata-file sample-metadata.tsv
–o-visualization taxa-bar-plots_otuid.qzv
qiime feature-table summarize
–i-table feature-table-2.qza
–o-visualization feature-table-2.qzv
–m-sample-metadata-file sample-metadata.tsv

i still cannot get the taxonomy in feature-table-2.qzv and no otu id in taxa-bar-plots_otuid.qzv. really confusing. what i want is an OTU ID to each taxonomy and numbers of otu in the taxonomy. thanks very much.

2 Likes


meaning I also want otu id in arrow mark place

2
for example the marked one, i want this id showing in taxa-bar-plots.tsv

Hi @Yanfei-Geng,
I think I can help with part of what you’re looking for, but some of it may be functionality that we don’t currently have in QIIME 2.

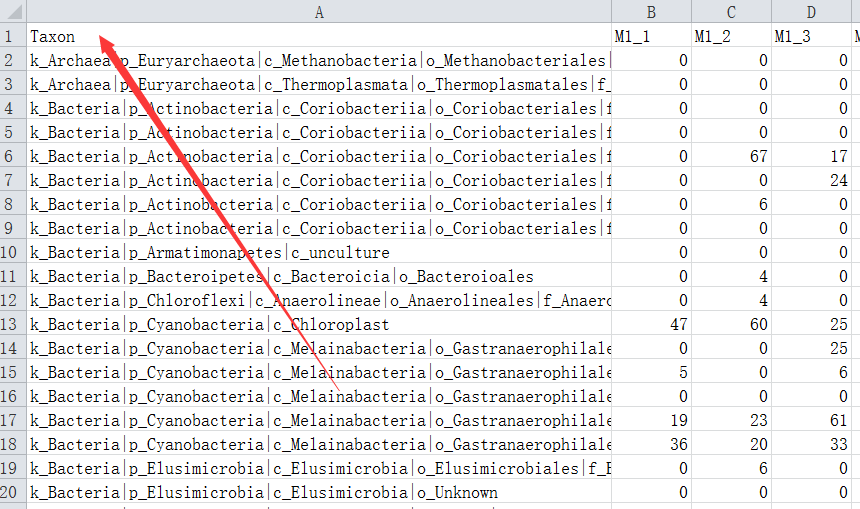
First, I think what you are looking for is the qiime taxa collapse command. This will group features together based on their taxonomy, and generate a new feature table where the feature ids are taxonomic labels.

You could run this as follows:

qiime taxa collapse \
  --i-table feature-table-2.qza \
  --i-taxonomy taxonomy.qza \
  --p-level 3 \
  --o-collapsed-table feature-table-class.qza

The value that you provide for --p-level may change, depending on how many taxonomic levels are used in your taxonomy. In my case, I’m assuming kingdom is level 1, phylum is level 2, and class is level 3.

In QIIME 2, the taxonomy is never included in the feature table, but always in the corresponding FeatureData[Taxonomy] artifact (the taxonomy.qza file, in this example). This is so that different taxonomies can be easily associated with a single feature table. If you want a .biom file with taxonomy, you can see how to do that here.

We don’t currently include feature ids (such as your JX870786) in the taxonomy barplots, as often there will be too many of them for that to be useful. You might try running qiime feature-table summarize and looking for that feature in the Feature Detail tab, as there will be some basic information about it there. Alternatively, if you need to see counts of that feature on a per sample basis, you can export the feature table, convert it to tsv with biom convert, and find that feature in the resulting tsv file to get that information.

We also don’t currently have a way to generate counts of the features that were grouped into each taxonomy. It should be fairly straight-forward to get that information though from the tabulated taxonomy. You can access that by running the following command, and then clicking the button for Download metadata as TSV file:

qiime metadata tabulate \
  --m-input-file taxonomy.qza \
  --o-visualization taxonomy.qzv

I hope this helps. Please let me know if you have any additional questions, or if I’ve misunderstood any of your questions.

Dear @gregcaporaso,
Thank you for your generous help. I think I didn’t make my questions clear before. To my understanding, take 16S analysis for example,consensus_taxonomy_all_levels.txt includes two information,one is genbank accession no.(like my second image), two is the corresponding taxon information, and 97_otus_16S.fasta also includes two information, one is genbank accession no., two is corresponding sequences. After we run
qiime feature-classifier classify-sklearn \

–i-classifier classifier.qza \

–i-reads rep-seqs.qza \

–o-classification taxonomy.qza

and other scripts needed, we can get taxonomy all levels you want. But for me, I am looking for the genbank accession no. for each taxonomy for my data. Hope I make my questions clear this time. Thank you for your time.

Hi @Yanfei-Geng,
I think I understand - it sounds like you’d like to know which genbank ids were most similar to your sequences (in the rep-seqs.qza file). Is that right? We unfortunately don’t have a way to get that information at the moment, though it is something we would like to add. This is in part because, with taxonomy assignment, typically more than one of the reference sequences is informing each individual taxonomy assignment.

If I understand what you’re looking for, you may be able to get this information using vsearch directly (not through QIIME 2). vsearch will already be installed in your QIIME 2 environment. A command that I’ve used for this before is:

vsearch --db dna-sequences.fasta \
  --usearch_global queries.fasta \
  --alnout out.aln \
  --blast6out out.bl6 \
  --id 0.0 \
  --maxaccepts 10 \
  --qmask none

This will do a BLAST-like search of all of the sequences in queries.fasta against the sequences in dna-sequences.fasta, and will report back the 10 best matches for each sequence in queries.fasta. We plan to make this accessible as a method in QIIME 2, but we haven’t done that yet. If this does do what you’re looking for, can you let me know? That type of feedback helps us to prioritize new functionality.

1 Like

Dear @gregcaporaso,
What i look for is exactly what you mentioned in your anwser. Now I am working on a project on diets of wild animals. We have our plants in animal feces analysed by vsearch, but the rumen bacterial community analysed by qiime2. So now it is hard for me to do the mantel test between plants diversity and bacterial diversity. Thank you again for your help.

1 Like

Great!

I'm happy to try to help with that if you explain the issue that you're having. This should definitely be possible to achieve with QIIME 2 if you have a feature table where the features are plant taxa (e.g., species identifiers) and the samples are the same (i.e., have the same identifiers) as the ones for which you have bacterial data.

what confuses me now is not mantel test any more, i finally find a way for mantel. I wonder how could I have an otu table, not the taxon table of every sample (like in the image)? Best.

Hi @Yanfei-Geng, I think the OTU table that you’re looking for should be the feature-table-2.qza artifact that you’ve been working with. You could export that with qiime tools export, and then convert the resulting .biom file to tab-separated text with biom convert --to-tsv. Would that get you what you need? If not, can you describe what the features are in your feature-table-2.qza file, and what you would like the features to be in the table you’re trying to generate?

hi@gregcaporaso the one you told me the output is like this


but the one I want is like following, is this possible?
7

@gregcaporaso hi,
I found something in alpha-rarefaction.qzv


after downloading, the table is like this
did i understand this table correctly? Thank you so so much.