Hi all, I have followed QIIME2R integration tutorial (Tutorial: Integrating QIIME2 and R for data visualization and analysis using qiime2R). I am trying to create PCOA plot with my bray curtis artifact distance matrix generated by QIIME2. Below is my code. I keep getting error "Error in bray$data$Vectors : $ operator is invalid for atomic vectors". Strangely, if I run is.atomic(bray) I get FALSE. Not sure what is happening here but appreciate help very much!!
bray$data$Vectors %>%
- select(SampleID, PC1, PC2) %>%
- left_join(metadata) %>%
- left_join(shannon) %>%
- ggplot(aes(x=PC1, y=PC2, color=
genotype, shape=gender, size=shannon)) + - geom_point(alpha=0.5) + alpha controls transparency and helps when points are overlapping
- theme_q2r() +
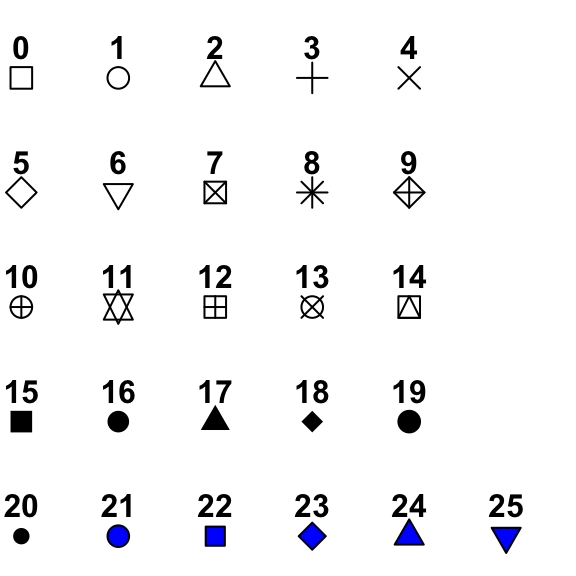
- scale_shape_manual(values=c(16,1), name="gender") + #see http://www.sthda.com/sthda/RDoc/figure/graphs/r-plot-pch-symbols-points-in-r.png for numeric shape codes
- scale_size_continuous(name="shannon") +
- scale_color_discrete(name="genotype")
Error in bray$data$Vectors : $ operator is invalid for atomic vectors