Any advice please how I can present my bar plots like that
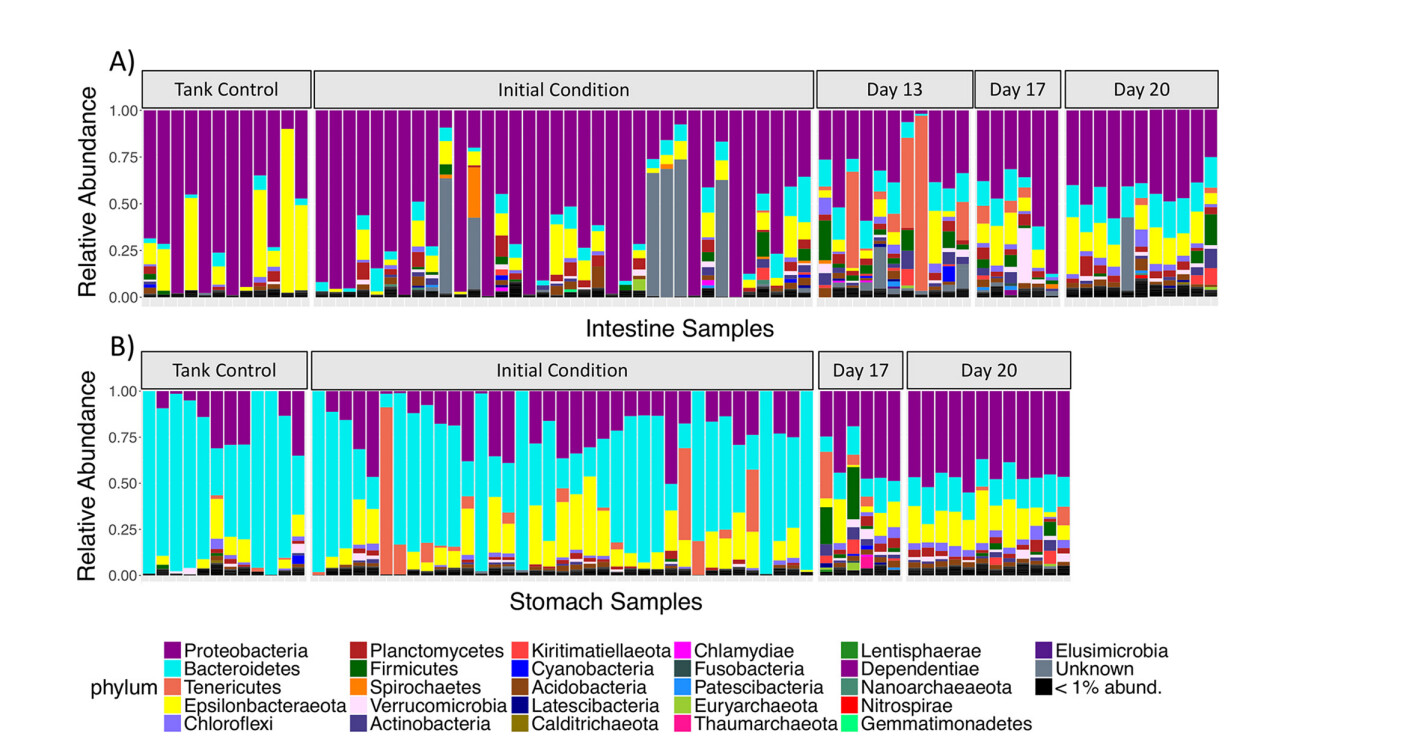
out of something like this

and Is it recommended to filter the low abundance taxa to be able to do this?
Any advice please how I can present my bar plots like that
out of something like this
and Is it recommended to filter the low abundance taxa to be able to do this?
I make plots like this using the R packages Phyloseq and ggplot2 + ggpubr. See the Restroom Biogeography example, and search for plot_bar
Yes! In these case they plot these low abundance taxa in a single <1% abundance group.
EDIT: Try the search 'publication quality bar plot' and pick the program you like best. And ask us any questions about how we think about making this common Figure 1 plot. ![]()
@colinbrislawn Thanks a lot for the guidance.
As this is my first steop into R, can you please share a script with me or share a link to a script where I can start to do my first relative abundance barplots in different test groups in the phylum level as a start?
Good morning,
If you want to make these in R, check out the Phyloseq plot_bar tutorial. You may find qiime2R helpful for importing your data.
I would love to share an example that 'just works, every time!' I find that I have to do some level of processing to my data before I get the graph I want. My process is
facet_grid(~Treatment)So the simple method is not complete, and the complete real world code is not simple.
Try some code for yourself and let us know if you have any questions!
You can use Microbiome analyst, taking OTU generated using Qiime2 ,its online tool.
This topic was automatically closed 31 days after the last reply. New replies are no longer allowed.
