Hi @clairewill22,
I think the way to interpret this is that the added information about sourcepop is not contributing much to the model accuracy. Given clear beta-diversity, you should be able to find a Q^{2} at least somewhat greater than zero. I will let @mortonjt verify my intuition.
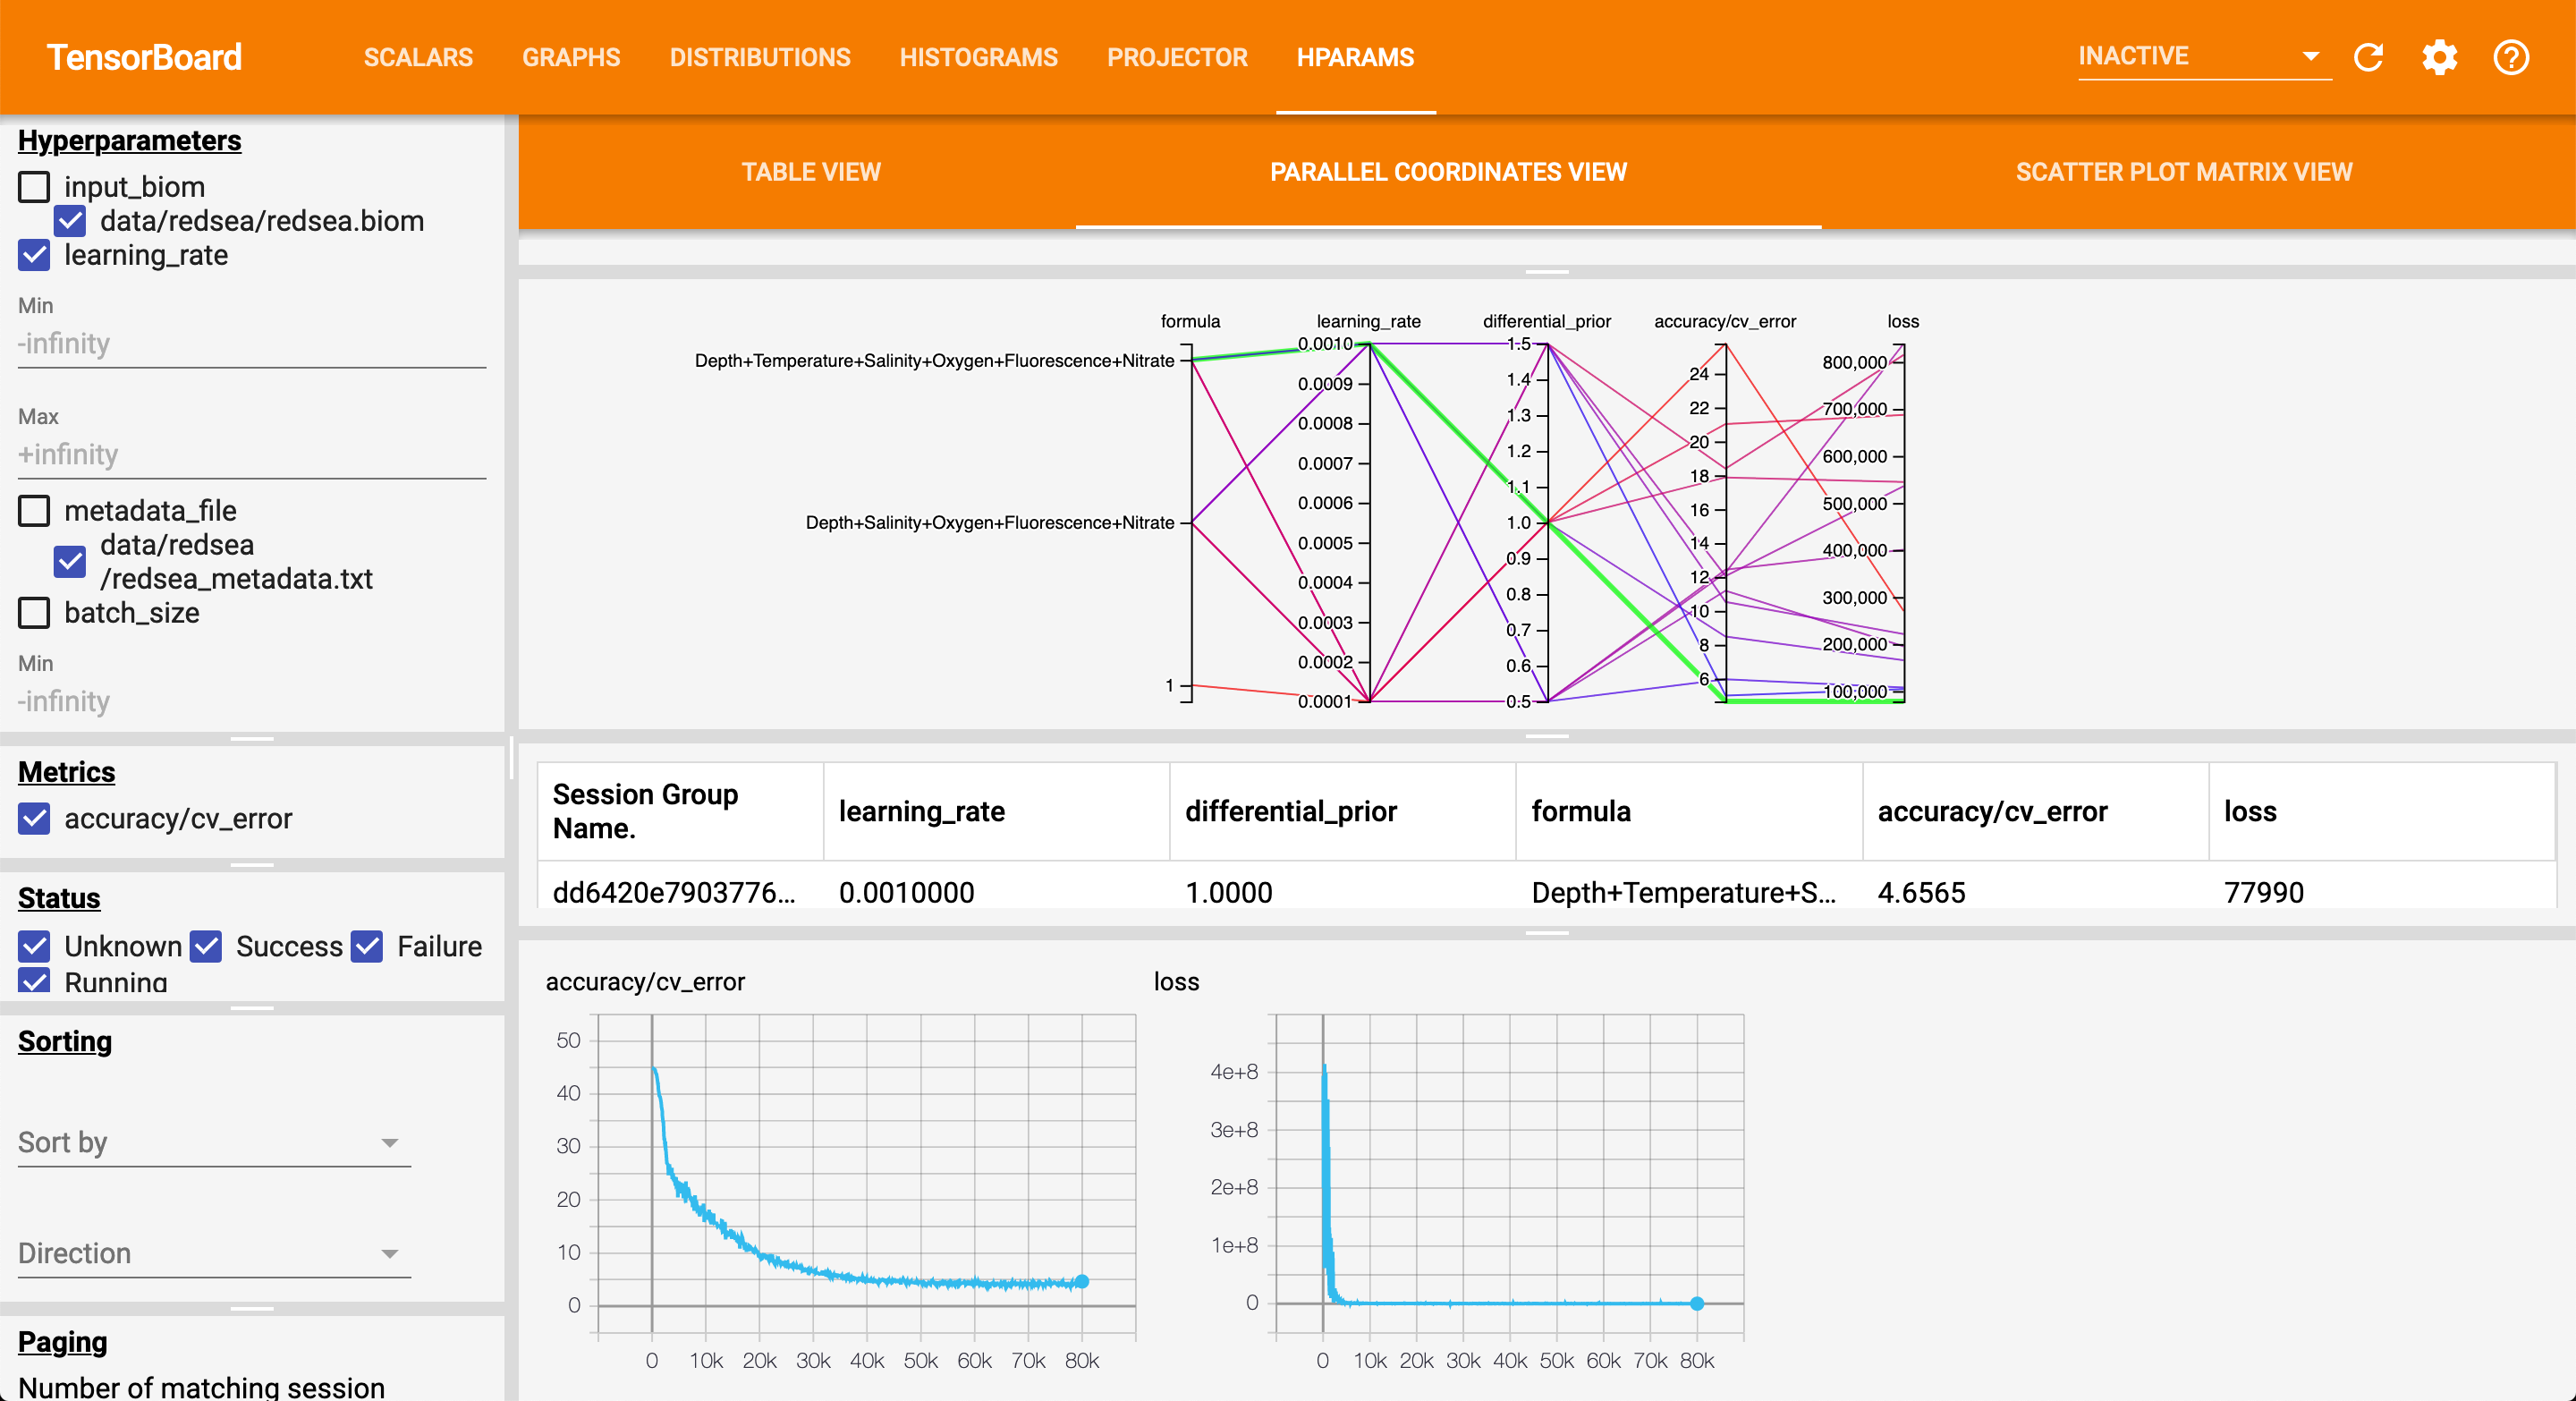
One helpful way to optimize in the standalone tool is to use a parallel coordinates plot as seen here. To generate that plot you will need to install the dev version by running pip install git+https://github.com/biocore/songbird. You need to run this pip install command inside an environment with songbird already installed (to account for the dependencies). Once you have the parallel coordinates plot you can compare all models to each other and to the baseline model of the same parameters. I would also suggest setting a random seed using the --random-seed parameter.
You want your Q^{2} to at least be slightly greater than zero. That being said, at the end of the day the songbird differentials are a useful guide map for choosing log-ratios to test (i.e. reference frames) (see this for more info). @fedarko has created Qurro which interactively allows you to explore log-ratios based on the songbird differentials. Once, you have a log-ratio of biological interest you can verify it by exporting the metadata with a new log-ratio column and then use a t-test between your groups of interest. @mortonjt can verify I am not leading you astray anywhere in my description.