Hi all,
I'm having issues optimizing the loss function for my dataset.
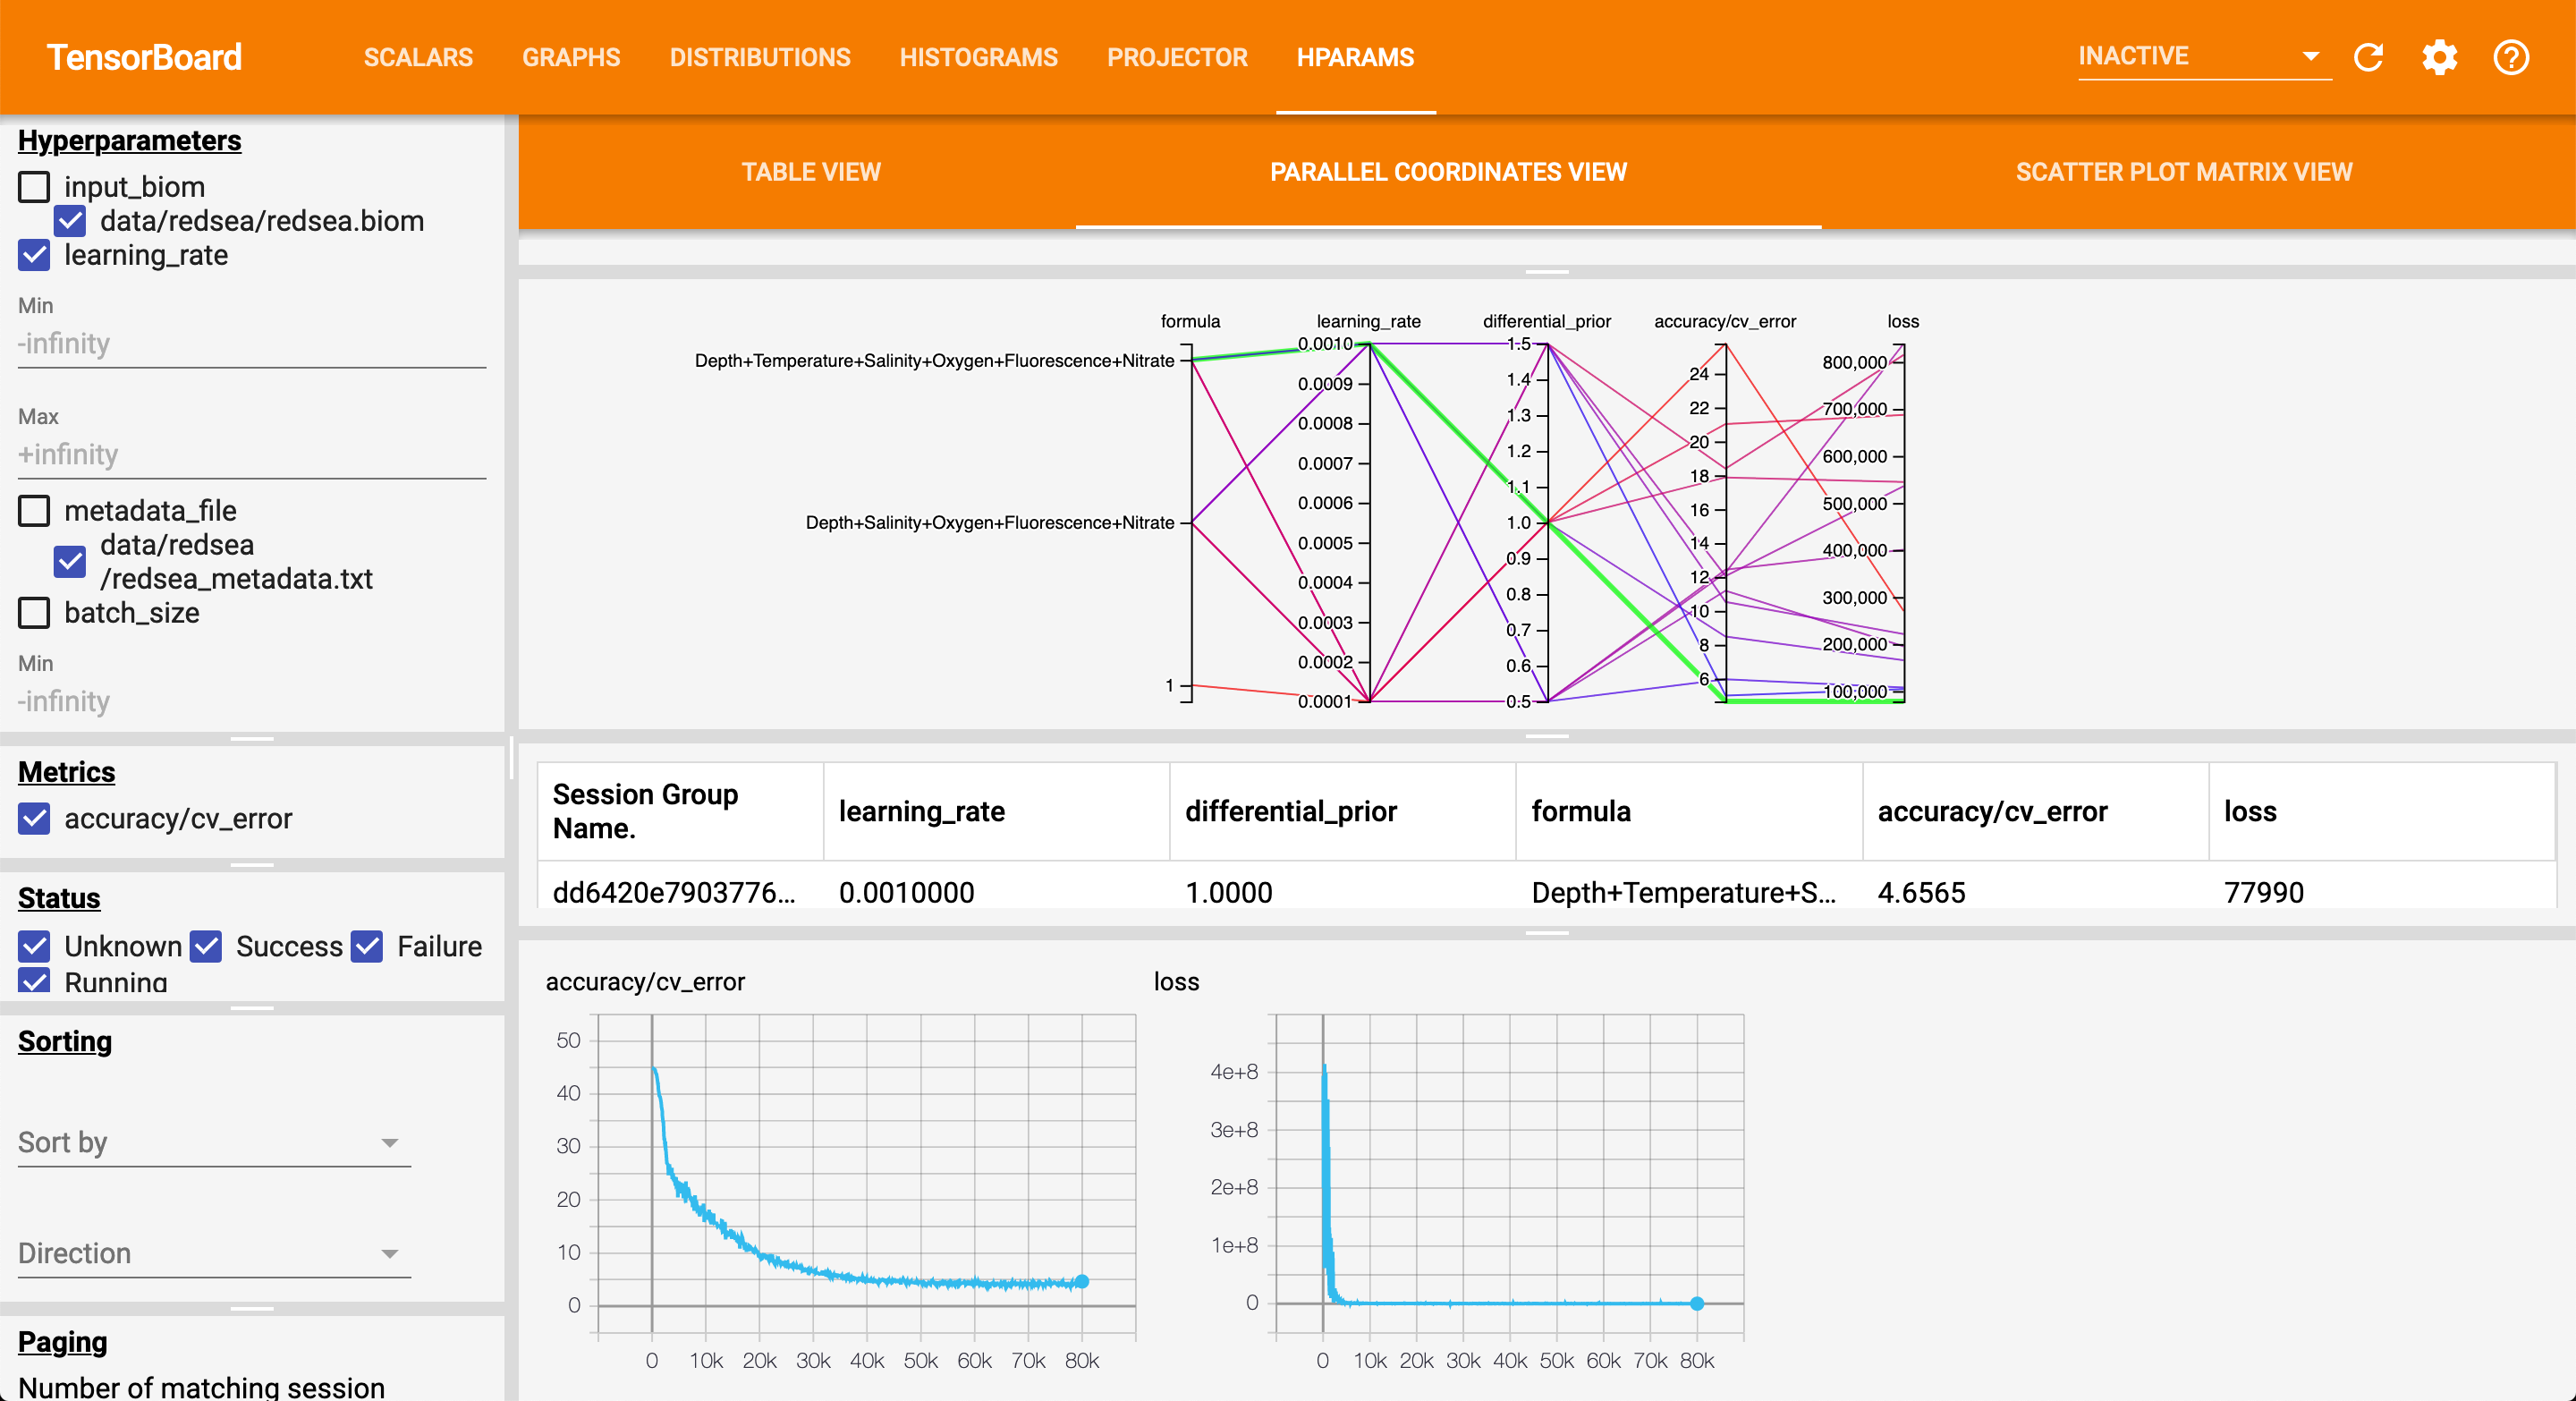
I'm unsure what numbers for this function are appropriate. In the songbird tutorial, I see that the loss function is pretty close to zero. Here are my tensorboard results (see photo), I've run it multiple times adjusting each time. The bottom red line is my most recent attempt. As you can see, it's getting closer to zero, but not at the rate I would hope.
Here's the songbird standalone command I ran last as well (As you can see I've tried adjusting many parameters). I used songbird through QIIME and got similar results, tensorboard was really useful for monitoring the changes though so I switched over to the standalone. I'm only running it on one column of my metadata.
It looks like you have already done a great job with the main parameters to adjust. I do not see any overfitting so the differential-prior is likely set well. I also see you set a training-column which is another main way to improve your model by accounting for non evenly distributed categories.
To verify your formula is improving the model fit I would suggest comparing against a null model. There is a tutorial to do this comparison here. Briefly, you want to ensure your model produces a Q^{2} as close to 1 as possible. You do this by running a second model with the same parameters but with the formula set to "1". The Q^{2} is defined as how well your model with the metadata performs over the 'baseline'. This can be thought of as being similar to a R^{2} value that you get from ordinary linear regression.
Let me know if you have any questions after reading section six in the tutorial link I sent.
@cmartino
I get a pretty low q-squared value.
(0.02), after optimization and comparison to a null model.
Does this mean that my parameters do not predict microbial community composition?
Or should I continue to adjust parameters and see if I can get a better fit?
There seems to be pretty clear differences in beta diversity with regard to these variables and when visualizing the taxonomic differences.
I guess I'm just not sure where the line is with trying to get the model to fit, and assuming that the data does not fit with the predictions.
I think the way to interpret this is that the added information about sourcepop is not contributing much to the model accuracy. Given clear beta-diversity, you should be able to find a Q^{2} at least somewhat greater than zero. I will let @mortonjt verify my intuition.
One helpful way to optimize in the standalone tool is to use a parallel coordinates plot as seen here. To generate that plot you will need to install the dev version by running pip install git+https://github.com/biocore/songbird. You need to run this pip install command inside an environment with songbird already installed (to account for the dependencies). Once you have the parallel coordinates plot you can compare all models to each other and to the baseline model of the same parameters. I would also suggest setting a random seed using the --random-seed parameter.
You want your Q^{2} to at least be slightly greater than zero. That being said, at the end of the day the songbird differentials are a useful guide map for choosing log-ratios to test (i.e. reference frames) (see this for more info). @fedarko has created Qurro which interactively allows you to explore log-ratios based on the songbird differentials. Once, you have a log-ratio of biological interest you can verify it by exporting the metadata with a new log-ratio column and then use a t-test between your groups of interest. @mortonjt can verify I am not leading you astray anywhere in my description.
@clairewill22 your plots look good! This is exactly how this tool was intended to be used.
Note that the Q2 isn't a perfect statistic, it serves as a rough guide to see if there are major issues with your model. As long as your Q2 is greater than zero, then your model is actually learning something useful.

