# Using PERMANOVA in R to compare unbalanced groups with small sample size
**URL:** https://forum.qiime2.org/t/using-permanova-in-r-to-compare-unbalanced-groups-with-small-sample-size/26618
**Category:** Other Bioinformatics Tools
**Tags:** permanova, adonis
**Created:** [May 26, 2023, 4:54pm UTC](https://forum.qiime2.org/t/using-permanova-in-r-to-compare-unbalanced-groups-with-small-sample-size/26618 "2023-05-26T16:54:50Z")
**Posts on this page:** 6
**Page:** 1
### Author:  [@col\_ahe](https://forum.qiime2.org/u/col_ahe)
#### Post date: [May 26, 2023, 4:54pm UTC](https://forum.qiime2.org/t/using-permanova-in-r-to-compare-unbalanced-groups-with-small-sample-size/26618/1 "2023-05-26T16:54:50Z")
Hello everyone!
I have been trying to use the pairwiseAdonis tool in R to compare different groups in my QIIME2 output. I converted my filtered SV table file, tree file, taxonomy file, and metadata file from QIIME2 into a phyloseq and used the DADA2 pipeline commands (taken from [here](https://benjjneb.github.io/dada2/tutorial.html)) to ordinate my samples on an NMDS plot. Each group of three samples enclosed in an ellipse indicates a set of biological replicates for a condition. The code for creating the phyloseq is as follows:
```auto
pswd <- qza_to_phyloseq(features = "Analysis2/16S-table-noplant-rarefied-10000_filtered.qza",
tree = "Analysis2/rooted-16S-tree-filteredSVs.qza",
taxonomy = "Analysis2/16S-rep-seqs-taxonomy.qza",
metadata = "Analysis2/metadata2.txt")
pswd.prop <- transform_sample_counts(pswd, function(otu) otu/sum(otu))
ord.nmds.bray_wd <- ordinate(pswd.prop, method="NMDS", distance="bray")
plot_ordination(ps.prop, ord.nmds.bray, color="Substrate", shape="Time", title="Bray NMDS") + geom_point(size = 4)
```
The resulting NMDS plot appears to show that my Day 90 groups differ more from each other than the Day 0 groups do:

I want to perform a PERMANOVA test to determine which Day 90 groups are significantly different from each other. However, pairwise PERMANOVA tests do not seem to work on my groups, and I think it is because each group has only three samples. When I run a pairwise PERMANOVA test to compare each group, it generates p values that are all \>0.05 and do not make sense. For example (highlighted in blue), the p value for group "4 Day 0" vs. group "6 Day 90" is 0.6, and the p value for group "4 Day 0" vs. group "6 Day 0" is also 0.6. This is an odd result, given that the "4 Day 0" and "6 Day 0" groups are much closer to each other on the NMDS plot than the "4 Day 0" and "6 Day 90" groups:

The code for this pairwise PERMANOVA test is as follows:
```auto
library(vegan)
meta_distance <- as(sample_data(pswd), "data.frame")
devtools::install_github("pmartinezarbizu/pairwiseAdonis/pairwiseAdonis")
library(pairwiseAdonis)
res <- pairwiseAdonis::pairwise.adonis(distance(pswd.prop, method="bray"), meta_distance$Group)
```
When I run this code, it gives the following error:
> 'nperm' \>= set of all permutations: complete enumeration.
> Set of permutations \< 'minperm'. Generating entire set.
I believe that for groups of only three samples, the number of total permutations that can be performed is less than adonis's default. Could this result in the nonsensical p values?
To try to work around this issue, I created a subset of my data that included only the "2 Day 90", "4 Day 90", "5 Day 90", and "6 Day 90" groups. Since I wanted to see if the "6 Day 90" group was significantly different than the other groups, I created a column in my data matrix named "Category". I assigned "2" in this column to the "6 Day 90" group and "1" to all of the other groups. I then created a distance matrix from this edited data matrix and performed a PERMANOVA test in which the distance matrix is "explained by" the "Category" factor. The code I used is as follows:
```auto
# Subsetting: 6 Day 90 vs. 2, 4, 5 Day 90
690_vs_2_4_5_D90 <- meta_distance %>%
filter(Group == "2 Day 90" |Group == "4 Day 90" | Group == "5 Day 90" | Group == "6 Day 90") # subsets my data
690_vs_2_4_5_D90$Category <- c(1,1,1,1,1,1,1,1,1,2,2,2) # creates Category column
690_vs_2_4_5_D90_dist <- 690_vs_2_4_5_D90 %>% # creates distance matrix from this data
select(all_of(.[["sample.id"]])) %>%
as.dist
adonis2(690_vs_2_4_5_D90_dist ~ Category, data = 690_vs_2_4_5_D90, permutations = 1000). # performs PERMANOVA analysis
```
This yields the following result (Pr(\>F) is the p value for the analysis):

This, I would think, indicates that samples in Category 2 are significantly different than samples in Category 1. For comparison, I then performed this same subsetted analysis on four of the the Day 0 groups, since they do not appear to be significantly different from each other on the NMDS plot:
```auto
# Subsetting: four Day 0 samples
D0 <- meta_distance %>%
filter(Group == "2 Day 0" | Group == "3 Day 0" | Group == "4 Day 0" | Group == "5 Day 0")
D0$Category <- c(1,1,1,1,1,1,1,1,1,2,2,2)
D0_dist <- D0 %>%
select(all_of(.[["sample.id"]])) %>%
as.dist
adonis2(D0_dist ~ Category, data = D0, permutations = 1000)
```
This yields the following result:
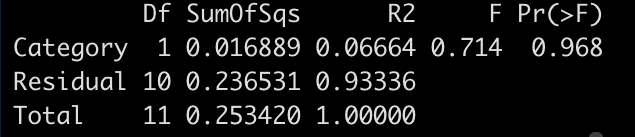
This would indicate that that samples in Category 2 are not significantly different than samples in Category 1, which aligns with what I see on the NMDS plot.
**I would like to know:** Is this subsetted analysis a valid way of comparing my groups to circumnavigate the issue of having a small sample size in my groups? Is there an issue with comparing a group of 3 samples to a combined group of 9 samples in a permutational analysis of variance? I appreciate any help and insight on this matter.
---
### Author:  [@colinbrislawn](https://forum.qiime2.org/u/colinbrislawn)
#### Post date: [May 26, 2023, 5:24pm UTC](https://forum.qiime2.org/t/using-permanova-in-r-to-compare-unbalanced-groups-with-small-sample-size/26618/2 "2023-05-26T17:24:51Z")
Hello Colleen,
Welcome to the forums! :qiime2:
> [@col\_ahe](#):
>
> I believe that for groups of only three samples, the number of total permutations that can be performed is less than adonis's default. Could this result in the nonsensical p values?
Probably. The ADONIS test partitions the distance matrix, then does permutations and calculates their variance. Few samples leads to high variance, so this could explain why the distributions overlap.
I may have missed this in your post, but before you started the pairwise tests, did you do a global adonis test on ~Day or on ~Substrate? What did it show?
---
### Author:  [@col\_ahe](https://forum.qiime2.org/u/col_ahe)
#### Post date: [May 26, 2023, 8:00pm UTC](https://forum.qiime2.org/t/using-permanova-in-r-to-compare-unbalanced-groups-with-small-sample-size/26618/3 "2023-05-26T20:00:43Z")
Thank you!
When I performed global adonis tests on ~Group and on ~Day, both tests returned p values \< 0.05. When I performed a global adonis test on ~Substrate, the p value was \> 0.05. I also tried a test on ~Substrate\*Day, which interestingly returned:

I don't know why Substrate has a p value \< 0.05 for this test when it is \> 0.05 for the other test.
---
### Author:  [@colinbrislawn](https://forum.qiime2.org/u/colinbrislawn)
#### Post date: [May 26, 2023, 8:33pm UTC](https://forum.qiime2.org/t/using-permanova-in-r-to-compare-unbalanced-groups-with-small-sample-size/26618/4 "2023-05-26T20:33:04Z")
> [@col\_ahe](#):
>
> When I performed global adonis tests on ~Group and on ~Day, both tests returned p values \< 0.05.
OK, cool. The R2 value is quite high for Day, which makes sense based on the graphs you showed!
I suspect you are right about the small sample sizes of the pairwise test increasing p-values. I would be inclined to only report on the global test.
---
### Author:  [@col\_ahe](https://forum.qiime2.org/u/col_ahe)
#### Post date: [May 27, 2023, 1:11am UTC](https://forum.qiime2.org/t/using-permanova-in-r-to-compare-unbalanced-groups-with-small-sample-size/26618/5 "2023-05-27T01:11:46Z")
Okay, thank you! To confirm one thing: my subsetted analysis essentially performs the global test, but on a subset of the data rather than all of the data. What do you think about the results of the subsetted test with ~Category -- are they not as trustworthy as performing the true global test with ~Day?
---
### Author:  [@colinbrislawn](https://forum.qiime2.org/u/colinbrislawn)
#### Post date: [May 27, 2023, 1:35am UTC](https://forum.qiime2.org/t/using-permanova-in-r-to-compare-unbalanced-groups-with-small-sample-size/26618/6 "2023-05-27T01:35:13Z")
Ah, sorry. I see what you are doing with the ~Category subgroup analyses.
This seems to work well. R2 = 0.335 means that 34% of the variance observed could be explained by that grouping, and I think that's pretty good.
> [@col\_ahe](#):
>
> Is this subsetted analysis a valid way of comparing my groups to circumnavigate the issue of having a small sample size in my groups? Is there an issue with comparing a group of 3 samples to a combined group of 9 samples in a permutational analysis of variance?
I'm not sure. Subgroup analysis is [suspicious](https://xkcd.com/882/)...
But I see how this cohort is motivated by the results of the global NMDS, and you are allowed to fight reviewer three!
Do you trust this result?