# Selecting and visualizing alpha/beta diversity analyses
**URL:** https://forum.qiime2.org/t/selecting-and-visualizing-alpha-beta-diversity-analyses/4432
**Category:** User Support
**Created:** [June 4, 2018, 8:29pm UTC](https://forum.qiime2.org/t/selecting-and-visualizing-alpha-beta-diversity-analyses/4432 "2018-06-04T20:29:17Z")
**Posts on this page:** 9
**Page:** 1
### Author:  [@Clara](https://forum.qiime2.org/u/Clara)
#### Post date: [June 4, 2018, 8:29pm UTC](https://forum.qiime2.org/t/selecting-and-visualizing-alpha-beta-diversity-analyses/4432/1 "2018-06-04T20:29:17Z")
Hi @Mehrbod_Estaki, may I know how can we view the .qza file? Because now I have completed the alpha and beta diversity analysis, but I can't figure out how is my samples alpha diversity look like? I read about this [Alpha and Beta Diversity Explanations and Commands](https://forum.qiime2.org/t/alpha-and-beta-diversity-explanations-and-commands/2282)
but all output files are in .qza file, whenever I try to open it, no figure will show up. Any advice? And among all the alpha diversity test, which is the most informative and essential?
---
### Author:  [@Mehrbod\_Estaki](https://forum.qiime2.org/u/Mehrbod_Estaki)
#### Post date: [June 4, 2018, 8:48pm UTC](https://forum.qiime2.org/t/selecting-and-visualizing-alpha-beta-diversity-analyses/4432/2 "2018-06-04T20:48:44Z")
---
### Author:  [@Mehrbod\_Estaki](https://forum.qiime2.org/u/Mehrbod_Estaki)
#### Post date: [June 4, 2018, 8:55pm UTC](https://forum.qiime2.org/t/selecting-and-visualizing-alpha-beta-diversity-analyses/4432/3 "2018-06-04T20:55:34Z")
Hi @Clara.
I've moved this question to its own topic as it was unrelated to the original thread topic. We ask that users post new questions under a separate topic instead of tagging along other topics as to keep the discussion on point. Thanks!
To visualize your .qza artifacts you need to create a visualization artifacts (.qzv) first. Have you had a chance to go through any of the qiime2 tutorials? For example in the Moving Pictures tutorial, there is a whole section describing [visualizing alpha and beta diversity](https://docs.qiime2.org/2018.4/tutorials/moving-pictures/#alpha-and-beta-diversity-analysis) analyses.
> [@Clara](#):
>
> And among all the alpha diversity test, which is the most informative and essential?
Unfortunately there is no such thing. All the various diversity metrics have been developed with special considerations in mind to fit a specific question. This is a decision that you and your group will have to make based on what the design of the experiment is and what question is being asked. You'll see in the literature that some are used more often than others such as observed\_otus, Shannon, and Simpsons indices but again you need to make sure their use fits your data. The link you provided is a great starting point as to what those metrics describe.
---
### Author:  [@Mehrbod\_Estaki](https://forum.qiime2.org/u/Mehrbod_Estaki)
#### Post date: [June 4, 2018, 8:55pm UTC](https://forum.qiime2.org/t/selecting-and-visualizing-alpha-beta-diversity-analyses/4432/4 "2018-06-04T20:55:55Z")
---
### Author:  [@Clara](https://forum.qiime2.org/u/Clara)
#### Post date: [June 4, 2018, 9:11pm UTC](https://forum.qiime2.org/t/selecting-and-visualizing-alpha-beta-diversity-analyses/4432/5 "2018-06-04T21:11:50Z")
Thanks @Mehrbod_Estaki.
I have gone through the tutorials some time ago but since it is not straight forward for all the available test, I didnt thought that I can modify them, now I got it!
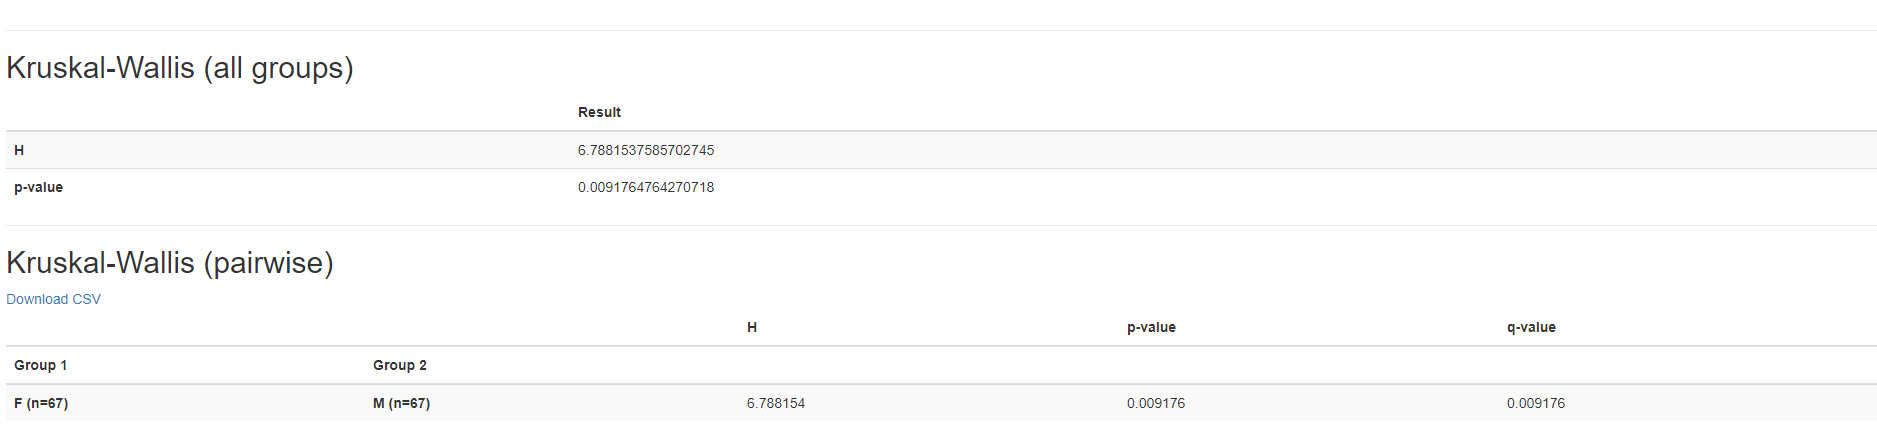
Yes, those are the alpha diversity analysis that I normally found in papers too. The other thing is, after run through the Shannon's index, I got something like this comparing between Male and Female. Is this means that the alpha diversity is significantly different between them since we got a value of P=0.009?
---
### Author:  [@Mehrbod\_Estaki](https://forum.qiime2.org/u/Mehrbod_Estaki)
#### Post date: [June 5, 2018, 5:01am UTC](https://forum.qiime2.org/t/selecting-and-visualizing-alpha-beta-diversity-analyses/4432/6 "2018-06-05T05:01:20Z")
Hi @Clara,
Glad you got it sorted out! I would again emphasize that the choice of metrics should be dependent on the question being asked, not just what is popular, since those might not actually be meaningful for your experiment.
> [@Clara](#):
>
> Is this means that the alpha diversity is significantly different between them since we got a value of P=0.009?
Correct! This indicates that when looking at males vs females (not accounting for any of the other possible variables) there is a significant difference. A side note, you should get in the habit of looking at the q-value instead of the p-value, since the q-value is an adjusted p-value taking into account for multiple testing. In this case since there is only 1 comparison both values are the same, but if you were looking at another category that had more than 2 levels, these values would be different.
---
### Author:  [@Mehrbod\_Estaki](https://forum.qiime2.org/u/Mehrbod_Estaki)
#### Post date: [June 5, 2018, 9:12pm UTC](https://forum.qiime2.org/t/selecting-and-visualizing-alpha-beta-diversity-analyses/4432/7 "2018-06-05T21:12:04Z")
An off-topic reply has been split into a new topic: [Interpreting alpha diversity visualization output](https://forum.qiime2.org/t/interpreting-alpha-diversity-visualization-output/4449)
Please keep replies on-topic in the future.
---
### Author:  [@ben](https://forum.qiime2.org/u/ben)
#### Post date: [June 5, 2018, 9:17pm UTC](https://forum.qiime2.org/t/selecting-and-visualizing-alpha-beta-diversity-analyses/4432/8 "2018-06-05T21:17:56Z")
@Clara The alpha/beta diversity question is probably one that comes up most in microbiome literature, the choice is ultimately the one you want to make your point with. However, we generally like Shannon Index Diversity because it favors less well-represented taxa in the lung (which is the area of my interest).
The beta diversity metrics can generally be weighted/unweighted UniFrac or Bray-Curtis.
---
### Author:  [@system](https://forum.qiime2.org/u/system)
#### Post date: [July 7, 2018, 3:17am UTC](https://forum.qiime2.org/t/selecting-and-visualizing-alpha-beta-diversity-analyses/4432/9 "2018-07-07T03:17:58Z")
This topic was automatically closed 31 days after the last reply. New replies are no longer allowed.