# Qiime2R Heatmap construction challenges
**URL:** https://forum.qiime2.org/t/qiime2r-heatmap-construction-challenges/24033
**Category:** Other Bioinformatics Tools
**Tags:** qiime2r, heatmap
**Created:** [August 30, 2022, 8:33pm UTC](https://forum.qiime2.org/t/qiime2r-heatmap-construction-challenges/24033 "2022-08-30T20:33:03Z")
**Posts on this page:** 2
**Page:** 1
### Author:  [@tafara\_bute](https://forum.qiime2.org/u/tafara_bute)
#### Post date: [August 30, 2022, 8:33pm UTC](https://forum.qiime2.org/t/qiime2r-heatmap-construction-challenges/24033/1 "2022-08-30T20:33:03Z")
I'm using Qiime2 2022.2. I have been trying to come up with a heat map in qiime2r following a tutorial by @jbisanz. Here is an output
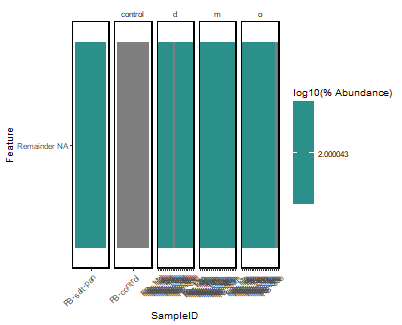.
Please help to guide me through, where I could have missed it. Below is the code I used to run the analysis.
library(tidyverse)
library(qiime2R)
metadata\<-read\_q2metadata("sample-metadata.txt")
SVs\<-read\_qza("table.qza")$data
taxonomy\<-read\_qza("taxa.qza")$data
SVs\<-apply(SVs, 2, function(x) x/sum(x)\*100)
SVsToPlot\<-
data.frame(MeanAbundance=rowMeans(SVs)) %\>%
rownames\_to\_column("Feature.ID") %\>%
arrange(desc(MeanAbundance)) %\>%
top\_n(30, MeanAbundance) %\>%
pull(Feature.ID)
SVs %\>%
as.data.frame() %\>%
rownames\_to\_column("Feature.ID") %\>%
gather(-Feature.ID, key="SampleID", value="Abundance") %\>%
mutate(Feature.ID=if\_else(Feature.ID %in% SVsToPlot, Feature.ID, "Remainder")) %\>%
group\_by(SampleID, Feature.ID) %\>%
summarize(Abundance=sum(Abundance)) %\>%
left\_join(metadata) %\>%
mutate(NormAbundance=log10(Abundance+0.01)) %\>%
left\_join(taxonomy) %\>%
mutate(Feature=paste(Feature.ID, Taxon)) %\>%
mutate(Feature=gsub("[kpcofgs]\_\_", "", Feature)) %\>%
ggplot(aes(x=SampleID, y=Feature, fill=NormAbundance)) +
geom\_tile() +
facet\_grid(~`depth`, scales="free\_x") +
theme\_q2r() +
theme(axis.text.x=element\_text(angle=45, hjust=1)) +
scale\_fill\_viridis\_c(name="log10(% Abundance)")
ggsave("heatmap.pdf", height=4, width=11, device="pdf")
Thank you in advance
---
### Author:  [@system](https://forum.qiime2.org/u/system)
#### Post date: [October 1, 2022, 2:33am UTC](https://forum.qiime2.org/t/qiime2r-heatmap-construction-challenges/24033/2 "2022-10-01T02:33:32Z")
This topic was automatically closed 31 days after the last reply. New replies are no longer allowed.