# Interpreting values from an ANCOM percentile abundance table
**URL:** https://forum.qiime2.org/t/interpreting-values-from-an-ancom-percentile-abundance-table/1497
**Category:** User Support
**Tags:** ancom
**Created:** [October 13, 2017, 7:21pm UTC](https://forum.qiime2.org/t/interpreting-values-from-an-ancom-percentile-abundance-table/1497 "2017-10-13T19:21:59Z")
**Posts on this page:** 9
**Page:** 1
### Author:  [@Lisa\_Crummett](https://forum.qiime2.org/u/Lisa_Crummett)
#### Post date: [October 13, 2017, 7:21pm UTC](https://forum.qiime2.org/t/interpreting-values-from-an-ancom-percentile-abundance-table/1497/1 "2017-10-13T19:21:59Z")
Hello, I am having problems interpreting exactly what the values in the cells represent in a percentile abundance table generated from an ANCOM analysis even after reading about percentile abundance tables online. The taxonomic level was "3" and the variable of interest was pH treatment value for a water sample (7.6 vs. 7.8 vs. 8.0 where "1.0" was a pseudo-value assigned to boat samples). I have attached my table in the form of an excel workbook. Can you please explain to me what specific values represent exactly in plain terms? For example what does the value in cell K6 represent? Thanks
---
### Author:  [@Lisa\_Crummett](https://forum.qiime2.org/u/Lisa_Crummett)
#### Post date: [October 13, 2017, 7:26pm UTC](https://forum.qiime2.org/t/interpreting-values-from-an-ancom-percentile-abundance-table/1497/2 "2017-10-13T19:26:59Z")
Sorry, I was not allowed to upload an excel file, only txt file so I have uploaded that here.
[percent-abundances from ANCOM.txt](https://cdck-file-uploads-global.s3.dualstack.us-west-2.amazonaws.com/flex002/uploads/qiime21/original/1X/99770515a59d2cd36a5e783add7eb2bc866118f4.txt) (7.7 KB)
---
### Author:  [@mortonjt](https://forum.qiime2.org/u/mortonjt)
#### Post date: [October 17, 2017, 4:40am UTC](https://forum.qiime2.org/t/interpreting-values-from-an-ancom-percentile-abundance-table/1497/4 "2017-10-17T04:40:34Z")
@Lisa_Crummett so there are a two headers that are important, namely `Percentile` and `Group`.
`Group` denotes the metadata category. In your case, there are only 4 different pH values, `1, 7.6, 7.8 and 8`, so these 4 values are your groups.
`Percentile` denotes the quartile values. For example if you look at the 3rd row denoted by `Unassigned; __;__ `, you'll notice that the percentiles in Group 1 are given as follows

This means the minimum value (denoted by Percentile 0) is 1 (which in your case is actually zero since you added a pseudocount in ANCOM). And your maximum (denoted by Percentile 100) is 57. The average (denoted by Percentile 50) is 23. Percentiles 25 and 75 just denote quartiles.
Does this make more sense?
---
### Author:  [@Daniela\_Vargas](https://forum.qiime2.org/u/Daniela_Vargas)
#### Post date: [October 23, 2017, 4:45pm UTC](https://forum.qiime2.org/t/interpreting-values-from-an-ancom-percentile-abundance-table/1497/6 "2017-10-23T16:45:34Z")
Hello all,
Thanks for the explanation @mortonjt, but just to clarify, I think that you meant that the "median" is denoted by percentile 50, right? Since not always the average value correspond to the percentile 50.
Thanks!
---
### Author:  [@jairideout](https://forum.qiime2.org/u/jairideout)
#### Post date: [October 24, 2017, 4:45pm UTC](https://forum.qiime2.org/t/interpreting-values-from-an-ancom-percentile-abundance-table/1497/8 "2017-10-24T16:45:50Z")
Yes that's right @Daniela_Vargas, thanks for the correction!
---
### Author:  [@Lisa\_Crummett](https://forum.qiime2.org/u/Lisa_Crummett)
#### Post date: [October 26, 2017, 11:22pm UTC](https://forum.qiime2.org/t/interpreting-values-from-an-ancom-percentile-abundance-table/1497/10 "2017-10-26T23:22:01Z")
I am sorry for the lag in my reply, I have been swamped with other stuff. So, I appreciate your reply but it still doesn't specifically explain what the values in the cells correspond to. I know that they are supposed to represent abundance of reads but that doesn't make sense to me...
Here is an example from my results:
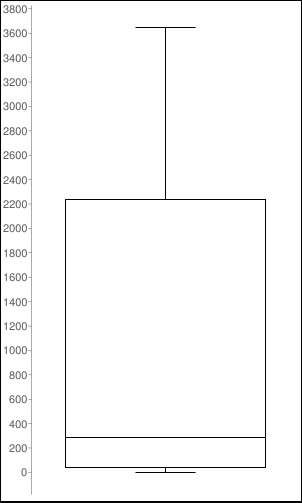
Bacteria X has the following percentiles from 0 to 100% respectively for treatment 1... 1 - 84 - 283 - 825 - 3645 whereas treatment 2 has the following percentiles... 19 - 327 - 1075 - 2143 - 179480.
For the 25% percentile, we have 84 for Treatment 1 vs. 327 for Treatment 2. Does this mean that 84 reads that are identified as Bacteria X in Treatment 1 equals 25% of the total reads identified as Bacteria X and that 285 reads that are identified as Bacteria X in Treatment 1 equals 50% of the total reads identified as Bacteria X? If that were true then why isn't 283 (50th percentile) twice the amount of 84 (25th percentile)? Also if this were true, why wouldn't we just look the 100th percentile to see how many total reads are associated with a given taxon? Can you please explain exactly what these numbers (in the cells) mean because they clearly can't be interpreted the same way that one would interpret percentiles for test scores for instance...
Thanks.
---
### Author:  [@gregcaporaso](https://forum.qiime2.org/u/gregcaporaso)
#### Post date: [October 31, 2017, 7:59pm UTC](https://forum.qiime2.org/t/interpreting-values-from-an-ancom-percentile-abundance-table/1497/14 "2017-10-31T19:59:52Z")
Hi @Lisa_Crummett,
You mentioned that the `bacteria X` (some taxon) percentiles for your `treatment1` category are as follows:
Min: 1
25th percentile: 84
50th percentile (median): 283
75th percentile: 825
Max: 3645
The interpretations of these values are as follows:
`Min`: in the table provided as input to `ancom`, of the samples in the `treatment1` group, in the sample with the lowest count of sequences assigned to `bacteria X`, one sequence was observed that was ultimately assigned the taxon `bacteria X`.
`25th percentile`: In 25% of the samples in the `treatment1` group, 84 or fewer sequences were observed that were ultimately assigned the taxon `bacteria X`.
`50th percentile (median)`: In half of the samples in the `treatment1` group, 283 or fewer sequences were observed that were ultimately assigned the taxon `bacteria X`.
`75th percentile`: In 75% of the samples in the `treatment1` group, 825 or fewer sequences were observed that were ultimately assigned the taxon `bacteria X`.
`Max`: Of the samples in the `treatment1` group, in the sample with the highest count of sequences assigned to `bacteria X`, 3645 sequences were observed that were ultimately assigned the taxon `bacteria X`.
The distribution of observed sequences that were ultimately assigned the taxon `bacteria X` in your `treatment1` samples should look something like the following. In this box plot, the line inside the box is the median, the top and bottom of the box are the 75th and 25th percentiles, respectively, and the top and bottom whiskers are the max and min respectively.
Does this help?
---
### Author:  [@Lisa\_Crummett](https://forum.qiime2.org/u/Lisa_Crummett)
#### Post date: [November 3, 2017, 10:55pm UTC](https://forum.qiime2.org/t/interpreting-values-from-an-ancom-percentile-abundance-table/1497/16 "2017-11-03T22:55:43Z")
Thank you very much Greg. This makes good sense!
Cheers,
Lisa
---
### Author:  [@system](https://forum.qiime2.org/u/system)
#### Post date: [December 5, 2017, 4:55am UTC](https://forum.qiime2.org/t/interpreting-values-from-an-ancom-percentile-abundance-table/1497/17 "2017-12-05T04:55:49Z")
This topic was automatically closed 31 days after the last reply. New replies are no longer allowed.