# facing challenges specifying color and shape commands in https://forum.qiime2.org/t/tutorial-integrating-qiime2-and-r-for-data-visualization-and-analysis-using-qiime2r/4121#plotting-pcoa-12
**URL:** https://forum.qiime2.org/t/facing-challenges-specifying-color-and-shape-commands-in-https-forum-qiime2-org-t-tutorial-integrating-qiime2-and-r-for-data-visualization-and-analysis-using-qiime2r-4121-plotting-pcoa-12/24032
**Category:** Other Bioinformatics Tools
**Tags:** qiime2r
**Created:** [August 30, 2022, 6:15pm UTC](https://forum.qiime2.org/t/facing-challenges-specifying-color-and-shape-commands-in-https-forum-qiime2-org-t-tutorial-integrating-qiime2-and-r-for-data-visualization-and-analysis-using-qiime2r-4121-plotting-pcoa-12/24032 "2022-08-30T18:15:30Z")
**Posts on this page:** 10
**Page:** 1
### Author:  [@tafara\_bute](https://forum.qiime2.org/u/tafara_bute)
#### Post date: [August 30, 2022, 6:15pm UTC](https://forum.qiime2.org/t/facing-challenges-specifying-color-and-shape-commands-in-https-forum-qiime2-org-t-tutorial-integrating-qiime2-and-r-for-data-visualization-and-analysis-using-qiime2r-4121-plotting-pcoa-12/24032/1 "2022-08-30T18:15:30Z")
I have been facing challenges to execute the following command ggplot(aes(x=PC1, y=PC2, color=depth , shape=season, size=shannon\_entropy)) + so that the functions color and shape retain something like this [color=`body-site`, shape=`reported-antibiotic-usage`]. I have my metadata file attached
[sample-metadata.txt](https://forum.qiime2.org/uploads/short-url/bjwXC9F7g6FRl20NRWulRQHgkKn.txt) (2.8 KB).
here is the code I'm trying to run
library(tidyverse)
library(qiime2R)
metadata\<-read\_q2metadata("sample-metadata.txt")
uwunifrac\<-read\_qza("unweighted\_unifrac\_pcoa\_results.qza")
shannon\<-read\_qza("shannon\_vector.qza")$data %\>% rownames\_to\_column("SampleID")
uwunifrac$data$Vectors %\>%
select(SampleID, PC1, PC2) %\>%
left\_join(metadata) %\>%
left\_join(shannon) %\>%
ggplot(aes(x=PC1, y=PC2, color=depth , shape=season , size=shannon\_entropy)) +
geom\_point(alpha=0.5) +
theme\_q2r() +
scale\_shape\_manual(values=c(16,1), name="") +
scale\_size\_continuous(name="Shannon Diversity") +
scale\_color\_discrete(name="depth")
ggsave("PCoA.pdf", height=4, width=5, device="pdf")
the error
Error in FUN(X[[i]], ...) : object 'season' not found
---
### Author:  [@ebolyen](https://forum.qiime2.org/u/ebolyen)
#### Post date: [August 31, 2022, 4:15pm UTC](https://forum.qiime2.org/t/facing-challenges-specifying-color-and-shape-commands-in-https-forum-qiime2-org-t-tutorial-integrating-qiime2-and-r-for-data-visualization-and-analysis-using-qiime2r-4121-plotting-pcoa-12/24032/2 "2022-08-31T16:15:54Z")
Hey @tafara_bute,
Just passing by, but wanted to thank you for including your metadata, I took a peek at it because I didn't see a good reason for your `ggplot` calls to fail, and I noticed that you have double quotes around each line, which is going to make most TSV/CSV parsers treat each row of data as a single really long entry/variable/factor.
If you delete those double quotes I expect things should work. You might also use
```R
str(metadata)
```
after loading via `read_q2metadata` so that you can visually verify that R has the right number of columns with the names you expect.
---
### Author:  [@tafara\_bute](https://forum.qiime2.org/u/tafara_bute)
#### Post date: [August 31, 2022, 5:30pm UTC](https://forum.qiime2.org/t/facing-challenges-specifying-color-and-shape-commands-in-https-forum-qiime2-org-t-tutorial-integrating-qiime2-and-r-for-data-visualization-and-analysis-using-qiime2r-4121-plotting-pcoa-12/24032/3 "2022-08-31T17:30:15Z")
thank you @ebolyen , I removed the double quotes and ran the str(metadata) command but no change, here is my console output
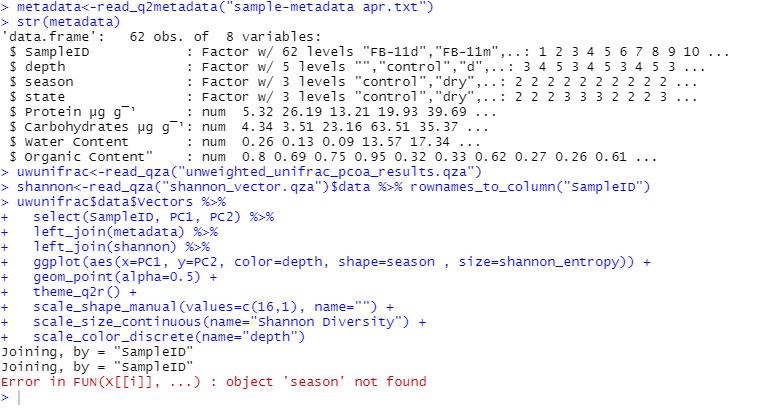
---
### Author:  [@ebolyen](https://forum.qiime2.org/u/ebolyen)
#### Post date: [August 31, 2022, 5:54pm UTC](https://forum.qiime2.org/t/facing-challenges-specifying-color-and-shape-commands-in-https-forum-qiime2-org-t-tutorial-integrating-qiime2-and-r-for-data-visualization-and-analysis-using-qiime2r-4121-plotting-pcoa-12/24032/4 "2022-08-31T17:54:05Z")
I believe `ggplot` is missing the data parameter, so it should be something like:
`ggplot(data=metadata, aes(...))`
I _think_ your x=PC1 and y=PC2 will just work on their own, but if not, you'll need to cbind them into your metadata as well.
---
### Author:  [@tafara\_bute](https://forum.qiime2.org/u/tafara_bute)
#### Post date: [August 31, 2022, 6:16pm UTC](https://forum.qiime2.org/t/facing-challenges-specifying-color-and-shape-commands-in-https-forum-qiime2-org-t-tutorial-integrating-qiime2-and-r-for-data-visualization-and-analysis-using-qiime2r-4121-plotting-pcoa-12/24032/5 "2022-08-31T18:16:18Z")
definitely ggplot is missing the parameter , i don't know why because its picking depth which is also in the same metadata file. How can i perform the cbind which you referred to ?
thank you\_
---
### Author:  [@lizgehret](https://forum.qiime2.org/u/lizgehret)
#### Post date: [September 6, 2022, 6:21pm UTC](https://forum.qiime2.org/t/facing-challenges-specifying-color-and-shape-commands-in-https-forum-qiime2-org-t-tutorial-integrating-qiime2-and-r-for-data-visualization-and-analysis-using-qiime2r-4121-plotting-pcoa-12/24032/6 "2022-09-06T18:21:48Z")
---
### Author:  [@ebolyen](https://forum.qiime2.org/u/ebolyen)
#### Post date: [September 6, 2022, 10:26pm UTC](https://forum.qiime2.org/t/facing-challenges-specifying-color-and-shape-commands-in-https-forum-qiime2-org-t-tutorial-integrating-qiime2-and-r-for-data-visualization-and-analysis-using-qiime2r-4121-plotting-pcoa-12/24032/7 "2022-09-06T22:26:00Z")
So `aes` uses nonstandard evaluation, which means that even though `color` happens first, it isn't actually executed, instead everything is "captured" for later. ggplot probably evaluates the shape before deciding the color, hence `season` being found as missing instead of `depth` as you expect.
As to how you provide the data, adapt the sample I gave in my last reply. You need to provide a `data` argument at the start of your `ggplot` call.
Regarding cbind, I would google around a bit, as `cbind`, `rbind`, `c()` and the various applies are all important tools for the toolbelt, and how you use them really depends on your situation. I would recommend just stuffing different dataframes and vectors into those functions to see what happens and go from there.
---
### Author:  [@ebolyen](https://forum.qiime2.org/u/ebolyen)
#### Post date: [September 6, 2022, 10:26pm UTC](https://forum.qiime2.org/t/facing-challenges-specifying-color-and-shape-commands-in-https-forum-qiime2-org-t-tutorial-integrating-qiime2-and-r-for-data-visualization-and-analysis-using-qiime2r-4121-plotting-pcoa-12/24032/8 "2022-09-06T22:26:08Z")
---
### Author:  [@tafara\_bute](https://forum.qiime2.org/u/tafara_bute)
#### Post date: [September 7, 2022, 7:17pm UTC](https://forum.qiime2.org/t/facing-challenges-specifying-color-and-shape-commands-in-https-forum-qiime2-org-t-tutorial-integrating-qiime2-and-r-for-data-visualization-and-analysis-using-qiime2r-4121-plotting-pcoa-12/24032/9 "2022-09-07T19:17:31Z")
thank you for the help. I tried renaming column names using
> colnames
function and it did the magic, I guess the problem was with the metadata column names.
---
### Author:  [@system](https://forum.qiime2.org/u/system)
#### Post date: [October 9, 2022, 1:18am UTC](https://forum.qiime2.org/t/facing-challenges-specifying-color-and-shape-commands-in-https-forum-qiime2-org-t-tutorial-integrating-qiime2-and-r-for-data-visualization-and-analysis-using-qiime2r-4121-plotting-pcoa-12/24032/10 "2022-10-09T01:18:16Z")
This topic was automatically closed 31 days after the last reply. New replies are no longer allowed.