Hi,
After running dada2 on our data-sets we get an extreme (un-biological) separation in 2 clusters, with random distribution of the healthy and diseased population .... Almost like there is a black-hole in between...
I have added the qzv-file. Rotate it a little around axis-2 and you'l see what I mean. (select Acne as scatter to see random distribution of two populations over the to clusters)
Anyone knows what caused this???unweighted_unifrac_emperor.qzv (821.0 KB)
1 Like
Are these separating out by sequencing run? (I see you merged two runs.) Batch effects would be a clear explanation for this.
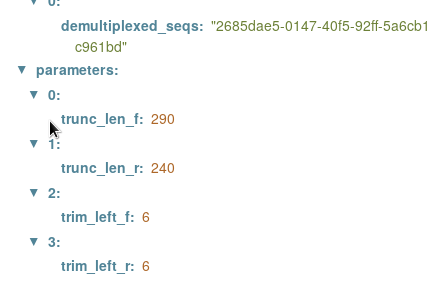
I also see in your provenance that you used different trim_left settings for each run. This would yield ASVs with 1-nt different start sites, leading to unique ASVs between runs. Quite possibly the cause…
3 Likes
Good afternoon @Koen1968,
Welcome to the Qiime 2 forums! ![]() I hope we can answer your question.
I hope we can answer your question.
I agree with you! That's a pretty big gap and we should look for it's source.
I've seen issues like this before in my own data sets when a confounding variable was inadvertently introduced. One time we learned that our mouse samples were from mice in two different buildings, and that was causing a seperation like this. Another time I saw this when my samples were processed on two different MiSeq runs. Could something like this have happened with your data set?
I took a look at the provenance of your data, and it looks to me like you imported two SingleLanePerSamplePairedEndFastqDirFmt objects. My best guess is that the two clusters you are seeing in the graph are the two different fastq files you imported.
Let me know what you find!
Colin
1 Like
3 or 4 samples were (Sequenced and) added later (those might be the ones with a different trimming), but the bulk was done on a single plate. These samples were all processed (DNA isolation, PCRs, purification) together. Samples are from humans. They were not co-housed 
2 Likes
Good! ![]()
![]()
Any other clues about what could be causing this? Let's solve this mystery! ![]()
![]()
1 Like
None whatsoever… We tried to look at position of the samples in the plate during processing (random), people that handled the samples (random), everything that we could think of…
Two different people did the analyses… same outcome. 
@Koen1968, I believe that @Nicholas_Bokulich raised a very good point above:
and
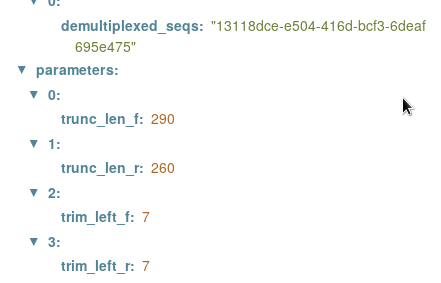
(so, not only are these different trim_left values, but also different trunc_len values, too)
These DADA2 settings will produce completely different ASVs, which in my opinion if likely the greatest cause for separation. A really easy way to check, without going back to the drawing board is to re-run core-metrics-phylogenetic with an updated metadata file that includes a new column that differentiates the samples in 13118dce-e504-416d-bcf3-6deaf695e475 vs 2685dae5-0147-40f5-92ff-5a6cb1c961bd. Then, once run, you can color the points by this new column in emperor.
3 Likes
Could have been the solution, if not for the fact that only 3 samples were added later (and treated with a 1 nucleotide difference in trimming). It doesn’t explain the extreme difference in the two groups of the other 80+ samples.
1 Like
Let’s try to triangulate the problem a little bit.
What do you see with other beta diversity metrics? Could you upload the emperor QZVs?
Perhaps you should also look at the Jaccard distances directly (e.g., with the beta-group-significance visualizer). Are any features shared between these two groups?
I see that the phylogeny was produced by align_to_tree_mafft_fasttree — is it possible that something is going wrong in the alignments? You could use q2-fragment-insertion to see how that impacts the results.
Now let’s go further back. I have some dumb questions (please bear with me):
- were all samples amplified with exactly the same primers?
- what primers did you use? Did they incorporate any kind of variable-length spacer or other such scheme?
- Are different samples in different read orientations?
- what library prep protocol did you use?
Okay now for the dumbest question of all:
5. are your sample metadata and sequences labeled correctly? I see that you are using integer sample IDs. This is a risky practice for a few reasons, including because it is easy to accidentally mix things up. I have seen cases where the sequencing center labels the output sequences that they deliver with arbitrary integer IDs, which makes it very easy to accidentally accept that they chose to label these using your sample IDs as opposed to realize that they are using their own arbitrary scheme. I have also seen cases where a collaborator sends some metadata labeled in integers and it is easy to assume that this corresponds to the sample ID scheme that you are using, as opposed to just being an arbitrary sample index on a list of values. I know, dumb suggestion, but worth double-checking given the odd results here.
4 Likes
This topic was automatically closed 31 days after the last reply. New replies are no longer allowed.