# Difference in raw read quality when using different import methods
**URL:** https://forum.qiime2.org/t/difference-in-raw-read-quality-when-using-different-import-methods/23270
**Category:** User Support
**Created:** [June 7, 2022, 1:55pm UTC](https://forum.qiime2.org/t/difference-in-raw-read-quality-when-using-different-import-methods/23270 "2022-06-07T13:55:14Z")
**Posts on this page:** 4
**Page:** 1
### Author:  [@Rob\_DNA](https://forum.qiime2.org/u/Rob_DNA)
#### Post date: [June 7, 2022, 1:55pm UTC](https://forum.qiime2.org/t/difference-in-raw-read-quality-when-using-different-import-methods/23270/1 "2022-06-07T13:55:14Z")
Hello,
currently I'm using a manifest file to import already demultiplex, paired .fastq.gz files, recently generated by Illumina MiSeq sequencing. The format of the manifest file looks like:
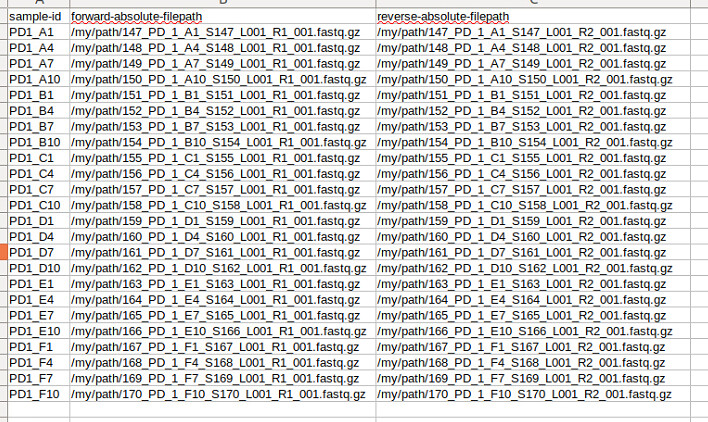
I import this data with the manifest file above using follow command:
```auto
qiime tools import \
--type SampleData[PairedEndSequencesWithQuality] \
--input-path manifest_file_PD1.tsv \
--input-format PairedEndFastqManifestPhred33V2 \
--output-path raw_reads_PD1.qza
```
summarize it by:
```auto
qiime demux summarize
--i-data raw_reads_PD1.qza
--o-visualization raw_reads_PD1.qzv
```
and next view it with:
`qiime tools view raw_reads_PD1.qzv`
This shows all my reads per sample and the quality plots etc. I like using a manifest file for reproducibility and overview and to easily edit the sample IDs when importing.
I now noticed that there is also another way to import this kind of data, using the example giving in the following page [Importing data — QIIME 2 2022.2.0 documentation](https://docs.qiime2.org/2022.2/tutorials/importing/) at "Casava 1.8 paired-end demultiplexed fastq".
So I can also important this data using following command:
```auto
qiime tools import \
--type 'SampleData[PairedEndSequencesWithQuality]' \
--input-path PD_1_data \
--input-format CasavaOneEightSingleLanePerSampleDirFmt \
--output-path raw_reads_PD1_import_test.qza
```
and then again summarize and view it:
```auto
qiime demux summarize \
--i-data raw_reads_PD1_import_test.qza \
--o-visualization raw_reads_PD1_import_test.qzv
qiime tools view raw_reads_PD1_import_test.qzv
```
Next I view (qiime tools view) and compare both the .qzv files of the 2 import methods.
The "overview" tab the sections demultiplexed sequence counts summary, the histogram and Per-sample sequence counts, look exactly the same for both files (except for the sample\_ID name in the per-ssample sequence counts). So, I have imported the same number of reads per sample. This is what I excepted, because I thought both methods above should do exactly the same?
However, when I checked the "Interactive quality plot" tab, I see there are some differences. The differences are very small, but they are there:
1. Quality plot using manifest file import:
2. Quality plot using CasaveOneEight import method:

How is this possible? What is the difference between these 2 methods for importing data? Based on the minor differences, I do not think the differences have any practical consequences, but I think it should be exactly the same.
Thanks!
**PS: I know noticed that in the manifest command, I did not put `SampleData[PairedEndSequencesWithQuality]` between apostrophes, but the importing worked so that cannot be the reason right?**
---
### Author:  [@timanix](https://forum.qiime2.org/u/timanix)
#### Post date: [June 7, 2022, 2:23pm UTC](https://forum.qiime2.org/t/difference-in-raw-read-quality-when-using-different-import-methods/23270/2 "2022-06-07T14:23:13Z")
Hello!
Just under quality plots you should see a text like this 😉:
> These plots were generated using a random sampling of 10000 out of 1925927 sequences without replacement. The minimum sequence length identified during subsampling was 244 bases. Outlier quality scores are not shown in box plots for clarity.
So you will not get absolutely identical plots even if you import reads with the same method several times.
---
### Author:  [@Rob\_DNA](https://forum.qiime2.org/u/Rob_DNA)
#### Post date: [June 7, 2022, 3:43pm UTC](https://forum.qiime2.org/t/difference-in-raw-read-quality-when-using-different-import-methods/23270/3 "2022-06-07T15:43:55Z")
ahhh right, makes sense. Thanks! 🙂
---
### Author:  [@system](https://forum.qiime2.org/u/system)
#### Post date: [July 8, 2022, 9:44pm UTC](https://forum.qiime2.org/t/difference-in-raw-read-quality-when-using-different-import-methods/23270/4 "2022-07-08T21:44:46Z")
This topic was automatically closed 31 days after the last reply. New replies are no longer allowed.