# Convert QIIME1 OTU table to QIIME2 taxa bar plot
**URL:** https://forum.qiime2.org/t/convert-qiime1-otu-table-to-qiime2-taxa-bar-plot/8696
**Category:** User Support
**Created:** [March 8, 2019, 10:09am UTC](https://forum.qiime2.org/t/convert-qiime1-otu-table-to-qiime2-taxa-bar-plot/8696 "2019-03-08T10:09:50Z")
**Posts on this page:** 7
**Page:** 1
### Author:  [@SteveMcL](https://forum.qiime2.org/u/SteveMcL)
#### Post date: [March 8, 2019, 10:09am UTC](https://forum.qiime2.org/t/convert-qiime1-otu-table-to-qiime2-taxa-bar-plot/8696/1 "2019-03-08T10:09:51Z")
Hi everyone,
I have a bunch of OTU tables (tab separated .txt file) with taxonomies created using QIIME 1.

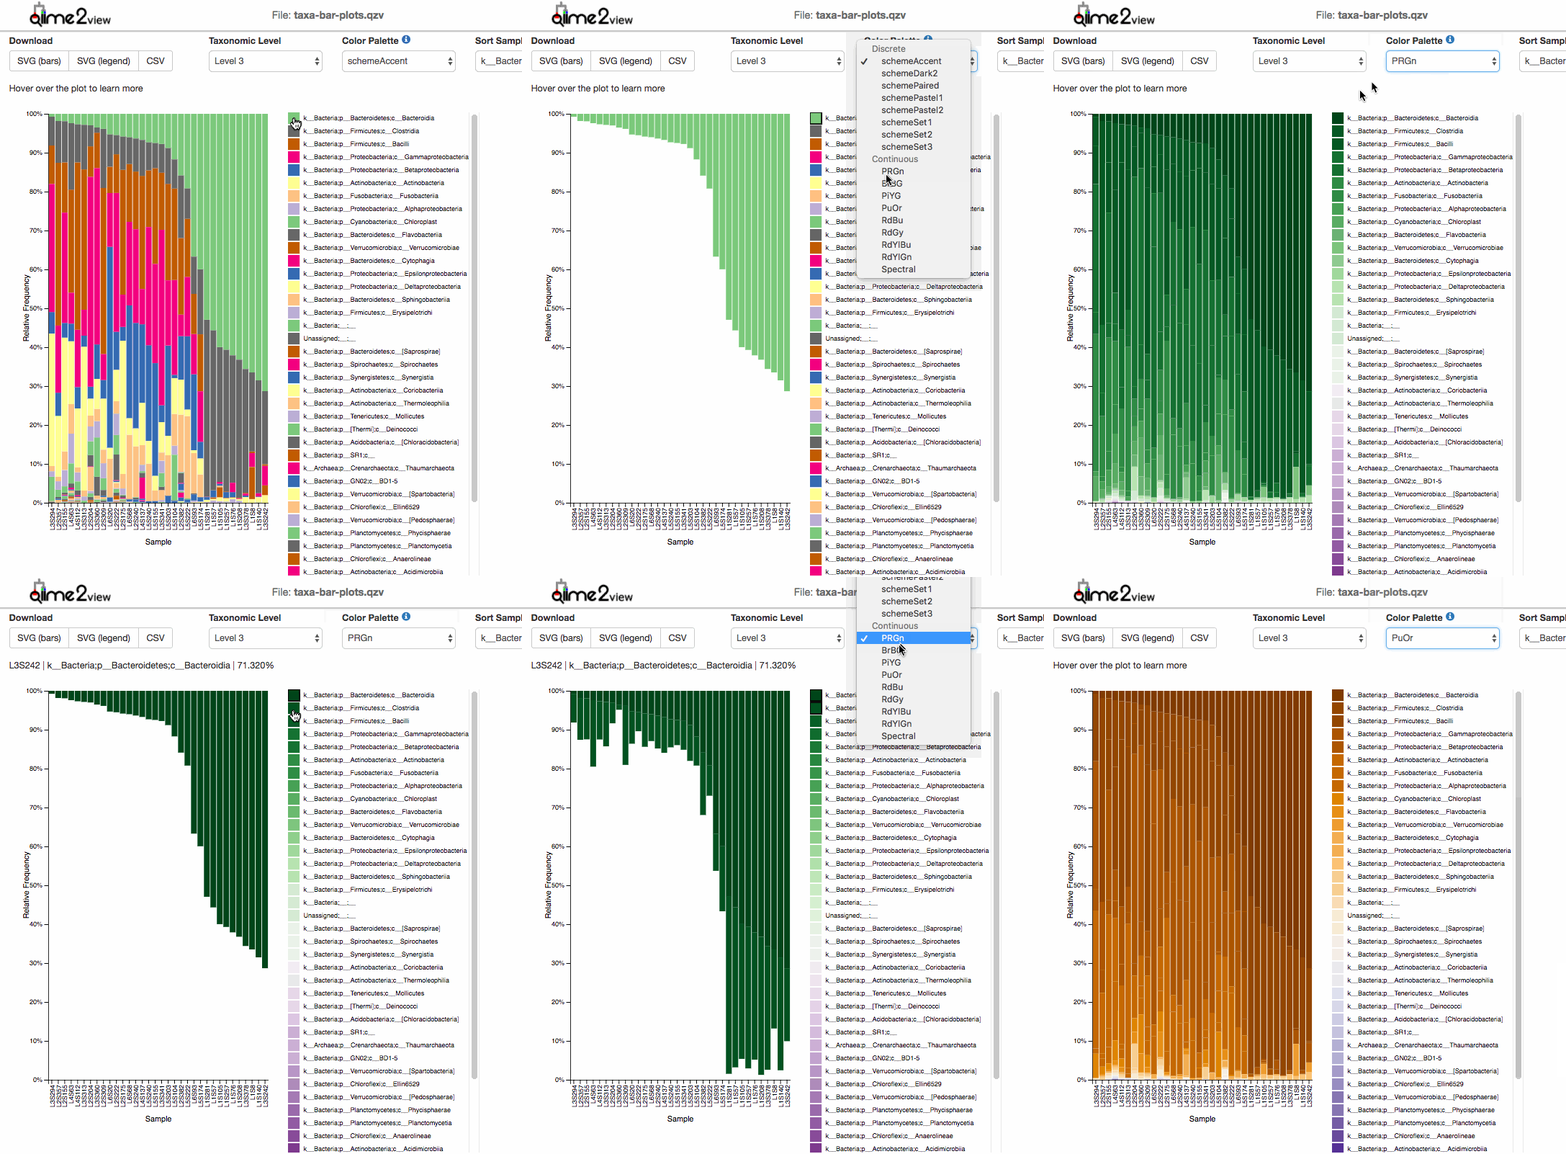
Is there way to directly convert them to the taxa bar plot (from Kingdom down to Species) in QIIME2? (Ideally not having to go through the .qza format)
---
### Author:  [@Nicholas\_Bokulich](https://forum.qiime2.org/u/Nicholas_Bokulich)
#### Post date: [March 8, 2019, 12:57pm UTC](https://forum.qiime2.org/t/convert-qiime1-otu-table-to-qiime2-taxa-bar-plot/8696/2 "2019-03-08T12:57:16Z")
Hi @SteveMcL,
> [@SteveMcL](#):
>
> Is there way to directly convert them to the taxa bar plot (from Kingdom down to Species) in QIIME2?
Yes!
1. [import as a feature table](https://docs.qiime2.org/2019.1/tutorials/importing/#feature-table-data).
2. You will also need to import your biom table as a `FeatureData[Taxonomy]` artifact to extract the taxonomy assignments. See this forum post for a prior example of steps 1 and 2: [Feature-table filter-samples removes taxonomy from biom table - #3 by thermokarst](https://forum.qiime2.org/t/feature-table-filter-samples-removes-taxonomy-from-biom-table/1159/3)
3. Once you have those files imported, it is as simple as using `qiime taxa barplot` to generate a barplot.
> [@SteveMcL](#):
>
> Ideally not having to go through the .qza format
Almost everything in QIIME 2 uses artifact (QZA) files. There is no way around that.
Good luck!
---
### Author:  [@Nicholas\_Bokulich](https://forum.qiime2.org/u/Nicholas_Bokulich)
#### Post date: [March 8, 2019, 2:05pm UTC](https://forum.qiime2.org/t/convert-qiime1-otu-table-to-qiime2-taxa-bar-plot/8696/4 "2019-03-08T14:05:49Z")
@SteveMcL
Correction. You can import your biom table as a `FeatureData[Taxonomy` artifact directly, no need to modify. I have amended the description above, with a link to a prior forum post demonstrating this.
---
### Author:  [@SteveMcL](https://forum.qiime2.org/u/SteveMcL)
#### Post date: [March 11, 2019, 6:25am UTC](https://forum.qiime2.org/t/convert-qiime1-otu-table-to-qiime2-taxa-bar-plot/8696/5 "2019-03-11T06:25:36Z")
Thanks a lot! I've managed to convert my .biom files into a bar plot vizualization.qza.
Now, I know I can visualize the .qza file on the QIIME2View website. But I'd like to send the results directly to collaborator without him having to upload it. Is there a way to convert the .qza file to an HTML file (like in QIMME1 one could view the results even without internet access)?
Also, is the bar plot the only taxa vizualization? What happened to the area plot?
Edit: I see there's a qiime tools export function which can convert to HTML. However, I'd still like to know if there are other options for visualization (ie, area chart and pie chart)? Also, could one adjust the height/width of the bars etc?
---
### Author:  [@Nicholas\_Bokulich](https://forum.qiime2.org/u/Nicholas_Bokulich)
#### Post date: [March 11, 2019, 12:28pm UTC](https://forum.qiime2.org/t/convert-qiime1-otu-table-to-qiime2-taxa-bar-plot/8696/6 "2019-03-11T12:28:24Z")
> [@SteveMcL](#):
>
> I’d like to send the results directly to collaborator without him having to upload it. Is there a way to convert the .qza file to an HTML file (like in QIMME1 one could view the results even without internet access)?
If you want someone to view without internet access, then exporting to HTML as you have already discovered is your best bet.
However, an even better option would be to deposit your results on dropbox, go to the qiime2 view website, and enter the link to that dropbox file in the line below (click where it says "link to a file on dropbox"). You can send the URL of that visualization to your collaborator.
> [@SteveMcL](#):
>
> However, I’d still like to know if there are other options for visualization (ie, area chart and pie chart)? Also, could one adjust the height/width of the bars etc?
There is no area or pie chart options. You can generate a heatmap with `qiime feature-table heatmap` if you prefer that visualization. There is currently not a way to adjust bar height/width in that visualization.
---
### Author:  [@thermokarst](https://forum.qiime2.org/u/thermokarst)
#### Post date: [March 11, 2019, 2:24pm UTC](https://forum.qiime2.org/t/convert-qiime1-otu-table-to-qiime2-taxa-bar-plot/8696/8 "2019-03-11T14:24:21Z")
> [@SteveMcL](#):
>
> Now, I know I can visualize the .qza file on the QIIME2View website. But I’d like to send the results directly to collaborator without him having to upload it
Good news - [https://view.qiime2.org](https://view.qiime2.org) doesn't actually receive any uploaded data, there is no server at all. When you "view" your QZV files there, the data stays local, on your machine. That means you can email these files to your collaborator, and they can view the results interactively without needing to install QIIME 2. This scheme can be compatible with your institution's IRB protocols, HIPAA, etc (we really don't want to be in the business of storing people's data!).
---
### Author:  [@system](https://forum.qiime2.org/u/system)
#### Post date: [April 11, 2019, 8:24pm UTC](https://forum.qiime2.org/t/convert-qiime1-otu-table-to-qiime2-taxa-bar-plot/8696/9 "2019-04-11T20:24:23Z")
This topic was automatically closed 31 days after the last reply. New replies are no longer allowed.