Is it possible to determine the numbers species (or unique ASVs) belonging to a given phyla or family in each sample? e.g. how many species of Firmicutes are in a given sample. Thanks.
If you make a taxonomy bar plot, you can download the data as a .csv file and see those numbers.
Try that and let us know what you find! ![]()
EDIT: I don't think that answered you question! See discussion below
Hi Colin
I have 100 samples belonging to 30 sub-classes and 5 classes. I trying to generate box plots showing mean, max, min number of unique ASV in Firmicutes (and other phyla, families) in each class and subclass. I am currently using taxa bar plots to determine the number of unique ASV in each sample at Phylum level. I sort, split the table into each phylum, move the data to GraphPad Prism to generate the box-plots. This manual processing is manageable at phylum level, as there are 7 phyla (as of now). It becomes too much work at family level.
I get observed-features in a sample as part of core-metrics data. I was wondering if there is a script which can generate observed features per phylum, per family in a sample.
Another approach I am thinking of is filter based on taxonomy (phylum, family) and then run core-metrics analysis on each filtered table. This will also involve lots of steps.
Regards
1 Like
I am not aware of any method to do it in Qiime2, only with custom scripts... ![]()
What scripting languages are you familiar with? Would you like me to put something together using R and Phyloseq?
I am familiar with R, qiime2R and phyloseq. I was able to create phyloseq object using qiime2R. Couldn't get done much beyond this. I was able to perform most of the analysis in qiime2. I would appreciate the scripts for phyloseq, if it is not too much work.
1 Like
I'll see what I can mock up, starting with a phyloseq object as the input.
No promises! ![]()
1 Like
Does this look like what you were looking for?
(We can adjust it so it shows exactly what you are looking for! ![]() )
)

Here's the code:
# Melt phyloseq object into data frame, with
# each row being a single feature.
ps.melt <- ps %>% psmelt()

# Now we can group by SampleType and count total number of Taxa in each
ps.melt %>%
  group_by(SampleType, Phylum) %>%
  summarise(nFeatures = n()) %>%
  filter(nFeatures > 1000) %>%
  ggplot(aes(x = SampleType, y = nFeatures, color = Phylum)) +
  scale_y_log10() +
  geom_point()
2 Likes
Looks like this will work. I will try this and update you. Thank you very much for doing this.
1 Like
Hi Colin
I tried the script. I think it is returning number of reads in each phylum. See figure below.

See below my calculations in Excel.
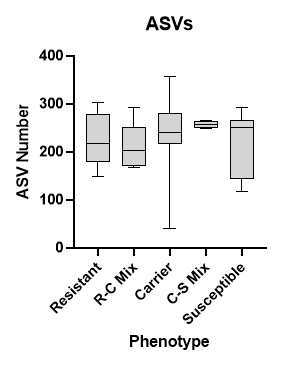
E.g. in Resistant group range of ASVs is 150-300. We have to count the number of unique ASV (or species, Genera) in a Phylum (or Family) in a group (or subgroup).
I appreciate your help, but do not want to take too much of your time. Thanks.
Thanks for trying that out. Looks like I missed a couple of important things.
First, after melting, make sure you are only counting features with abundance > 0.
Second, summarize these by Sample / SampleID as well.
Note: My data.frame column names may be different than yours, so be sure to update this code to match your 'melted' phyloseq object.
ps.melt %>%
  # Remove ASVs that do not appear in a sample
  filter(Abundance > 0) %>%
  # For each Sample (with it's associated Type), take the Phylum...
  group_by(Sample, SampleType, Phylum) %>%
  # ... and count it
  summarize(nFeatures = n()) %>%
  # Filter for Phyla of interest (or don't and see all of them)
  filter(Phylum %in% c("Firmicutes", "Actinobacteria")) %>%
  # Plot
  ggplot(aes(x = SampleType, y = nFeatures)) +
  facet_grid(~Phylum) +
  scale_y_log10() +
  geom_boxplot()
Let's see if we can get our number to match at the Phylum level, then extend this to Family!
1 Like
Thank you very much. It worked.

Could you please direct me to a tutorial about how to format the graph. I want to change axis labels, size, etc.
Yes! I built that using ggplot2. It's a pretty popular package, so you can google questions about formatting and find lots of examples, too!
1 Like
This topic was automatically closed 31 days after the last reply. New replies are no longer allowed.